Quantcast
Channel: GameDev.net
Viewing all 17925 articles
Browse latest View live

Shader Cross Compilation and Savvy - The Smart Shader Cross Compiler

$
0
0

Introduction


Many computer scientists suggest that the modern use of shaders originated from the RenderMan Interface Specification, Version 3.0, originally published in May, 1988. In the present, shaders have proven their flexibility and usefulness when writing graphics intensive applications such as games and simulations. As the capabilities of Graphics Processing Units (GPUs) keep increasing, so do the number of shader types and shader languages.

While there are many shader languages available to the modern programmer, the most prominent and used ones are the High Level Shading Language for the DirectX graphics API and the OpenGL Shading Language for the OpenGL API.

The Problem


Every modern rendering or game engine supports both APIs in order to provide their users with maximum portability and flexibility. What does this mean to us programmers? It means we either write every single shader program twice or find a way to convert from one language to the other. This is easier said than done. The functionality between HLSL and GLSL doesn't differ that much, however the actual implementation of even the simplest diffuse program is completely different in both languages.

Every developer who has ever done cross platform development has ran into the same problem. Of course the problem has already been partially solved in many different ways, however all of the available tools seem to lack two-way conversion, are completely outdated or completely proprietary.

A Solution


Because of the lack of a general-purpose solution, I thought it would be great to create a flexible free tool, which deals with at least Vertex and Fragment/Pixel shader conversion between modern GLSL 4.5 and HLSL 5.0. That's how the idea for Savvy - The Smart Shader Cross Compiler came to be. The initial idea was to create the tool with support for just the above mentioned languages, however the final implementation can easily be extended to support conversion from and to any language. What this enables is the fact that Savvy is entirely written in C++ and utilizes template classes as well as the latest C++11 advancements.

The solution chosen is far from being the best for the presented problem, however it is a solution, which is worth serious consideration.

Approach


The approach I decided to use is pure text-based parsing and conversion. The way the system works is really simple, but very powerful. The input shader is first ran through a lexical scanner (generated by the great Flex tool), which matches predefined sequences of characters and returns a specific token. Each returned token is then processed through a grammar parser (a simple flat state machine in this case), which determines whether the text is legitimate and should be saved. The saving is performed inside a database structure, which holds all processed information. That information is later used by a shader constructor class, which constructs the output shader.

External Dependencies


The goal of the whole project was to keep the external dependencies as low as possible. The only external software used was flex - the fast lexical analyzer, created by Vern Paxson. It is fast, reliable and great at matching extremely complex character combinations using regular expressions. I absolutely recommend it to anyone looking to do advanced file parsing and token matching. Initially I also wanted to use a third party grammar parser, however after a lot of thought on the subject I decided that syntax checking is not going to be part of the initial release, as the scope would just become overwhelming. This made me use a simple flat state machine which would handle all the grammar. So far so good, now let's see how all of it actually fits together. I'll try to keep things as abstract as possible, without delving too much in implementation details.

Architecture


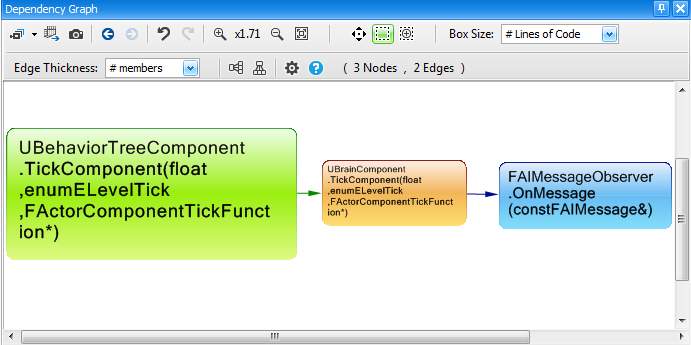
The image below shows a very basic look of the architecture. The Shader Converter class is the main contact point between the user and the internal components of the tool. All conversion calls are made through it. It owns a list of Lexical Scanners, Grammar Parsers and Shader Constructors. All of them are pure virtual base classes, which are implemented once for each supported language. Each Grammar Parser owns a Database and each Shader Constructor owns a Shader Function Converter. The Shader Function Converter takes care of converting all intrinsic functions, which do not have direct equivalents in the output language. The Database also stores the output language equivalents of all built-in data types and intrinsic functions. This type of architecture makes sure that the tool is easily extendable if support for a new language is added.


YfATfEV.png


Interface and Functionality


The Shader Converter has functions for converting a shader from file to file, file to memory, memory to file and memory to memory. All the conversion functions follow the same pattern. Inside the function, all the input is first validated and then an input stream is opened from the path specified. After that, the Lexical Scanner for the appropriate input language is called until an End of File instruction is reached. Each call of the function GetNextToken returns the next token in the stream. The token corresponds to a predefined set of characters in a sequence. For example, the token SAVVY_DATA_TYPE is returned for every data type use. The returned token and its string are then used as an input to the Parser class' ParseToken function, which determines the state and saves the word to the database if needed. If the input and output shader languages specified are the same, the shader is simply copied over to the specified path without any alterations. Any included files are also parsed in the same fashion, by calling the parsing function recursively.

After the file has been parsed, the input steam is closed and an output stream is opened. Then the Constructor is called and everything saved in the database is output to the stream. The order of construction is:

1. Construct Defines
2. Construct Uniform(Constant) Buffers
3. Construct Samplers(Textures)
4. Construct Input Variables
5. Construct Output Variables
6. Construct Custom User Types(structs)
7. Construct Global Variables
8. Construct Functions


The Function Converter


I feel like I should spend some time explaining what the Function Converter class actually does. Its job is to make sure each intrinsic function of the input language is translated to the appropriate equivalent of the output language. Unfortunately, there are some functions which are absolutely impossible to translate as they refer to very specific graphics API calls. To give an example, consider the HLSL function D3DCOLORtoUBYTE4. The problem here becomes apparent, as there is no UBYTE4 data type in GLSL. Upon reaching a function which cannot be converted to the specified output language, an exception will be thrown (or an error code will be returned if the preprocessor directive SAVVY_NO_EXCEPTIONS is defined) by the tool and conversion will stop.

There are, however, some functions which can be translated, despite the fact that they do not have direct alternatives in other languages. One such function is the arc hyperbolic cosine function in GLSL - acosh (well, technically all hyperbolic functions apply here, as none of them are supported in HLSL). The function itself, given an input value x can easily be defined as the following equation:

log(x + sqrt(x * x - 1));

When functions of this type are encountered, they are substituted by their inline version.

The final type of function conversions which the Function Converter handles are those which do have alternatives, but for some reason the output language implementation takes a different amount of arguments or the argument order is swapped. An example of a function which has the exact same functionality, but is implemented differently in both languages is the arc tangent function – atan. In GLSL, the function has two possible blueprints. One takes one argument (the y over x value) and the other takes the two inputs, x and y, separately. This is a problem, as the HLSL equivalent does not have an overloaded blueprint for two arguments. Instead, it uses a separate function – atan2. To account for this difference the function converter determines the number of arguments a function call has and according to that, outputs the correct type of function call. If the input shader language has a function which takes one argument less than its output language equivalent, a dummy value will be declared on the line above the call and the last argument will be filled by it, in order to preserve the functionality.

An Odd Case


To add one more function example to the last type – the fmod function in HLSL and its "supposed" GLSL equivalent – mod. At first glance everything looks great and both versions of the shader should produce the same results, right? Wrong! The internal equations used by those functions are not the same. The GLSL one, according to the official documentation is:

x - y * floor(x/y)

While the HLSL one is:

x = i * y + f

Both implementations produce the same results if dealing with positive numbers as inputs, however, the moment the input becomes negative, the HLSL version fails to produce the expected results. It also seems like other cross compilers prefer the former direct approach of converting mod to fmod and vice versa, as it is faster when executing the shader. I decided to choose the mathematically correct equation and whenever these functions are encountered in the input shader, the proper inline equation will be constructed in the output shader.

Conversion from File to File


Here is what the declaration of the file to file conversion function looks like:

/*
Converts a shader file from a file to another file.
*/
ResultCode ConvertShaderFromFileToFile(FileConvertOptions& a_Options);

As you can see, the function takes a structure of type FileConvertOptions, which contains all the needed data for the conversion. For example - shader input path, shader output path, entry points and shader type. Here is a sample usage of the file to file conversion:

Savvy::ShaderConverter* converter = new Savvy::ShaderConverter();
Savvy::ResultCode res;
Savvy::FileConvertOptions options;
options.InputPath = L"PathToMyInputFragShader.glsl";
options.OutputPath = L"PathToMyOutputFragShader.hlsl";
options.InputLang = Savvy::GLSL_4_5;
options.OutputLang = Savvy::HLSL_5_0;
options.ShaderType = Savvy::FRAGMENT_SHADER;

res = converter->ConvertShaderFromFileToFile(options);

Conversion from Memory


Another great feature which wasn't initially planned but was implemented at a later stage is conversion of shaders from memory to memory, memory to file and file to memory. In order to make things easier for the user, the Blob class was created, which is very similar to the DirectX 11 one and is just a container for raw data. Its interface is very simple, but effective for the user as it serves for sending raw character strings to the converter and also retrieving the converted ones after the conversion has been done.

The internal conversion is done by constructing a string stream from the Blob and having the scanners and parsers operate on that. A simple example of how one can use the Blob to Blob conversion is the following:

Savvy::ShaderConverter* converter = new Savvy::ShaderConverter();
Savvy::ResultCode res;

// Load file in memory
std::ifstream is("SomeFile.something");
if (!is.is_open())
{
    std::cout << "Error reading file" << std::endl;
}
std::string fileStr(static_cast<std::stringstream const&>(std::stringstream() << is.rdbuf()).str());
is.close();
 
// Create a blob with the loaded file in memory
Savvy::Blob inputBlob(&fileStr[0], fileStr.size());
Savvy::Blob outputBlob;
Savvy::BlobConvertOptions options;
options.InputBlob = &inputBlob;
options.OutputBlob = &outputBlob;
options.InputType = Savvy::HLSL_5_0;
options.OutputType = Savvy::GLSL_4_5;
 
res = converter->ConvertShaderFromBlobToBlob(options);
 
// Output the converted blob to file to verify its integrity
std::ofstream str("BlobToBlobTest.txt");
std::string mystring(options.OutputBlob->GetRawDataPtr(), options.OutputBlob->GetDataSize());
str << mystring;
str.close();

Extending the Tool


While the current implementation only supports conversion of Vertex and Fragment programs between modern GLSL and HLSL shading languages, it is very easy to extend the tool and add support for custom languages and shader types. The supported languages are separated into supported output languages and supported input languages. If the user wishes to extend the tool to support an extra output language, they need to create their own Constructor class by inheriting from the base class. After they have done that, the only thing needed is to call the following function supplying an ID and a default extension for the new output language.

/*
Registers a new custom shader language for output purposes only.
If the ID of this shader type is used as an input, the conversion will fail.
*/
template<typename ConstructorClass>
ResultCode RegisterCustomOutputShaderLang(uint32 a_ID, const wchar* a_DefaultExtension);

In order to add support for a new input language, the user needs to supply custom Lexical Scanner and Parser classes and also register them using the following function:

/*
Registers a new custom shader language for input purposes only.
If the ID of this shader type is used as an output, the conversion will fail.
*/
template<typename ScannerClass, typename ParserClass>
ResultCode RegisterCustomInputShaderLang(uint32 a_ID);

Note that a default extension here is not needed as a shader from this language will never be constructed. Likewise, support for a new shader type (geometry, compute) can also be added.

Current Limitations


Of course no software is without its flaws. Savvy is far from perfect. In this section I'll go in a bit more detail about the current shortcomings of the tool and the chosen approach in general.

Texture Samplers


The thing with GLSL is that the Texture Sampler and Texture objects are joined together in one, while in HLSL you have to explicitly declare a Sampler Object together with the Texture Object. When manually writing a shader you can use one Sampler to sample multiple Textures, however when programatically converting a GLSL shader to an HLSL one, there is no way of knowing how many samplers we might need, as OpenGL keeps Sampler Objects on the C++ side. A lot of people don't even use Samplers in OpenGL yet, as they are quite a new extension there. In order to make sure every texture is going to be properly sampled in HLSL, every declaration inside a GLSL shader produces both a Texture Object and a Sampler Object, which is named: NameofTextureObject + Sampler. For example: DiffuseTextureSampler. This is less than ideal, as we are consuming more Sampler Registers than we need, but unfortunately there is no other way at this point in time, using purely text-based conversion.

The Preprocessor


Another thing which is not 100% foolproof is the preprocessor conversion. Unfortunately there is no way of knowing which variables on global scope will be inside a specific preprocessor block. Because the tool stores everything in a database, there is no way for it to check if a specified variable is active or inactive in the current global scope. There is also no way of guaranteeing how many variables are inside a preprocessor block and of what type they are (inputs, outputs or uniforms/constant buffers). In order to avoid the issues which come with many branching preprocessor directives, I have decided not to support any conditional compilation outside of functions (Global Scope). Defines are still supported and will always be the first thing constructed. Conditional compilation is also supported inside functions without any constraints. This is possible due to the fact that every function is translated line by line and is guaranteed to keep its consistency across multiple languages.

Syntax Checking


Another big constraint of the tool is that it does not support any syntax checking, so if the user feeds it a shader which does not compile as an input, the output shader will not compile either. There are some internal checks in place, to make sure the tool isn't processing complete garbage, but they are far from being a reliable syntax verifier. In truth, syntax checking is possible to implement and might even be considered in the future, but for now it stays in the unsupported category.

Future Development


The current officially supported languages are GLSL 4.5 and HLSL 5.0. I have done some testing with GLSL shaders as far back as version 3.3 and they seem to work nicely, however take my words with a pinch of salt. The officially supported shader types are Fragment/Pixel and Vertex. Savvy is currently in Beta stage and after some proper testing and code documentation will be released, together with the source in the public domain. That way anyone who is interested in the project can contribute or use it as a base to make something else. There are many features planned for the tool, the biggest one of which is to add support for the upcoming intermediate shader language SPIR-V, which was announced at the Game Developer Conference 2015. Adding support for extra shader types like geometry and compute is also something planned for the future. Implementing a legacy GLSL profile is not out of the question either, if there is interest for it.

Conclusion


I must say, developing this tool was a very interesting journey. A lot of hours were put in it and a lot of valuable lessons were learned. I decided to write this article as there aren't many articles dedicated to this particular problem out there. I hope it was useful to anyone interested in shader cross-compilation and cross-platform graphics development in general. Its aim was to explain the solution I chose to overcome the problem of shader cross-compilation and also highlight some positive/negative points about the approach. If I missed anything or you have extra questions, ideas or feedback, please do share them. I love hearing other people's opinions and I'm always open to constructive criticism.

Useful Links


Article Update Log


19 April 2015: Initial version of the article released.

Call Unity3D Methods from Java Plugins using Reflection

$
0
0

Unity is a great game engine to develop mobile games. It brings a lot of functionality with easy to use tools. But as you go deeper in creating Android games with Unity there comes a time when you have to extend Unity by your own Android Java plugins. Unity's documentation is decent enough to get started. Sometimes in your Java code You need to call a Unity method. Unity has a way to do it through UnitySendMessage which is available when you extend UnityPlayerActivity (Or UnityPlayerNativeActivity). But I didn't want to extend UnityPlayerActivity, instead I wanted to write plugins for different jobs and make them useful in other projects too. I wanted to have several plugins for different jobs and seperated from each other so extending UnityPlayerActivity was not a good choice. By the way, you may have 3rd-party plugins that already extend UnityPlayerActivity. In this article you will learn how to do it in this way (not extending UnityPlayerActivity)


NOTE: I suppose you know already how to create a Java plugin for unity. If you don't please see Unity's Documentation.

Unity Part


In Unity you have to prepare a GameObject with a name. In this article I use the default GameObject that you have when you create a new scene in Unity, Main Camera. Rename "Main Camera" to "MainCamera" (We will use this name in Java to call a Unity Method in the future). Then write a script that contains a public method which receives a string as input and returns nothing (void) This is the method that's going to be called. Its name is also important because it is also used in Java code. maybe some method like this:

public void OnJavaCall(string message)
{
    Debug.Log(message);
}

I kept it as simple as possible, the method just logs the message. Attach the script that you just wrote to the MainCamera.

The Java Part


In your Java code you can now call the method (OnJavaCall in this example). You have to write out code similar to what's shown below:

public static void CallUnityFunc(Activity activity)
	{
		Log.i(Tag, "Calling unity function");
		
		
		try 
		{
			
			Field UnityPlayer = activity.getClass().getDeclaredField("mUnityPlayer");
			
			UnityPlayer.setAccessible(true);
			
			Method method = UnityPlayer.getType().getDeclaredMethod("UnitySendMessage", String.class,String.class,String.class);
            
			method.setAccessible(true);
			method.invoke(activity, "MainCamera","OnJavaCall","Hello Unity , From Java");

			
		} 
		catch(Exception e)
		{
			Log.e(Tag,e.getClass().toString()+"  "+ e.getMessage());
		}
		
	}

I wrote a static method that takes an Activity as input. We will pass the Unity player to this Method in the future. In the method declaration as you can see I use reflection to call the UnitySendMessage. UnitySendMessage takes three parameters : The GameObject's name (MainCamera in this example), Method's name (OnJavaCall here), and The message that is going to be sent as an arguement to our method (OnJavaCall).

To test it now you have to compile your plugin (which is an Android library project) to generate a .jar file. After that you know of course you have to copy the .jar file to your Unity project.

Back to Unity


Then in Unity, call that static method (CallUnityFunc here) we wrote in Java to see how it works. for example:

AndroidJavaClass classPlayer = new AndroidJavaClass("com.unity3d.player.UnityPlayer");
AndroidJavaObject activity = classPlayer.GetStatic<AndroidJavaObject>("currentActivity");

AndroidJavaClass PluginClass = new AndroidJavaClass("com.helper.bazaarpayment.PluginClass");// put your own package and class name accordingly to your Java plugin

//so let's call it 
PluginClass.CallStatic("CallUnityFunc",activity);

Note that this code will not work untill you actually run it on an Android device. It's good to check for runtime platform through Application.platform.

Note that when you make this call to Java, The MainCamera (containing the script that has OnJavaCall) that we created must be present, otherwise there won't be any GameObject with name MainCamera that has a OnJavaCall method. You may want to use GameObject.DontDestroyOnLoad to ensure you have MainCamera in all places.

Compile and run to see how it works. You can use the adb interface located at platform-tools folder in your Android sdk folder. With command: adb logcat -s Unity you can see Unity logs.

With this approach you don't have to extend UnityPlayerActivity. You can have self-contained plugins for distinct tasks. You can also leave 3rd-party plugins that extend UnityPlayerActivity to work untouched.

Dynamic vertex pulling with D3D11

$
0
0

Motivation


The motivation is very simple: regular hardware instancing is suddenly not enough for the current project. The reason for this is the amount of different trees, for which the simple arithmetic works:

  1. 9 base types of trees
  2. 3 growth stages for each tree (a branch, a small tree and a big tree)
  3. 3 health stages for each growth stage for each tree (healthy, sick and dying)
  4. 5 LODs for each health stage for each growth stage for each tree (including impostors)
  5. This creates a serious combinatorial explosion, which makes regular instancing a lot less effective.

Below I suggest a solution that allows one to bypass this problem and to render all these different trees with a single draw call, while having a unique mesh and unique constants per each object.

Main idea


D3D11 and GL4 support [RW]StructuredBuffer (D3D) and ARB_shader_storage_buffer_object (GL), which represent some GPU memory buffer with structured data. A shader can fetch the data from this buffer by an arbitrary index.

I suggest to use 2 global buffers to store vertices and indices and to fetch the data from there in a vertex shader using a vertex ID.

This way we can supply an offset to this buffer as a regular constant and start fetching vertices starting from this offset.

How do we implement this?

Logical and physical buffers


Let us introduce two terms: a physical buffer and a logical buffer.

A physical buffer is a GPU memory buffer which stores all indices and vertices of our geometry. Essentialy it is a sort of a "geometry atlas" - we pack all our mesh data there.

A logical buffer is a data structure that contains physical buffer offset and a data block size.

These two terms are easily illustrated with the following picture:


Attached Image: logicalandphysicalbuffer.png


In C++ this will look like this:

struct DXLogicalMeshBuffer final
{
    uint8_t* data             = nullptr;
    size_t   dataSize         = 0;
    size_t   dataFormatStride = 0;
    size_t   physicalAddress  = 0;
};

The struct fields are used for:
  • data : a pointer to the buffer data
  • dataSize : Buffer data size in bytes
  • dataFormatStride : One buffer element size
  • physicalAddress : Physical buffer offset, by which this buffer data is located. This field is set when physical buffer is updated (see below)
Upon logical buffer creation a physical buffer must know about the logical buffer to create a storage space for it.

Physical buffer class looks like this:

struct DXPhysicalMeshBuffer final
{
    ID3D11Buffer*             physicalBuffer     = nullptr;
    ID3D11ShaderResourceView* physicalBufferView = nullptr;
    size_t                    physicalDataSize   = 0;
    bool                      isDirty            = false;

    typedef DynamicArray<DXLogicalMeshBuffer*> PageArray;
    PageArray allPages;

    DXPhysicalMeshBuffer() = default;
    inline ~DXPhysicalMeshBuffer()
    {
        if (physicalBuffer != nullptr)     physicalBuffer->Release();
        if (physicalBufferView != nullptr) physicalBufferView->Release();
    }

    void allocate(DXLogicalMeshBuffer* logicalBuffer);
    void release(DXLogicalMeshBuffer* logicalBuffer);
    void rebuildPages(); // very expensive operation
}

The class fields are used for:
  • physicalBuffer : An actual buffer with the data
  • physicalBufferView : A shader resource view for shader data access
  • physicalDataSize : Buffer data size in bytes
  • isDirty : A flag that indicates the need for buffer update (it is needed after each logical buffer allocation/deallocation).
  • allPages : All logical buffers allocated inside this physical buffer.
Each time a logical buffer is allocated/deallocated a physical buffer needs to be informed about this. Allocate/release operations are quite trivial:

void DXPhysicalBuffer::allocate(DXLogicalMeshBuffer* logicalBuffer)
{
    allPages.Add(logicalBuffer);
    isDirty = true;
}

void DXPhysicalBuffer::release(DXLogicalMeshBuffer* logicalBuffer)
{
    allPages.Remove(logicalBuffer);
    isDirty = true;
}

rebuildPages() method is much more interesting.

This method must create a physical buffer and fill it with the data from all used logical buffers. A physical buffer must be mappable to RAM and bindable as a structured shader resource.

size_t vfStride = allPages[0]->dataFormatStride; // TODO: right now will not work with different strides
size_t numElements = physicalDataSize / vfStride;

if (physicalBuffer != nullptr)     physicalBuffer->Release();
if (physicalBufferView != nullptr) physicalBufferView->Release();

D3D11_BUFFER_DESC bufferDesc;
bufferDesc.BindFlags           = D3D11_BIND_SHADER_RESOURCE;
bufferDesc.ByteWidth           = physicalDataSize;
bufferDesc.Usage               = D3D11_USAGE_DYNAMIC;
bufferDesc.MiscFlags           = D3D11_RESOURCE_MISC_BUFFER_STRUCTURED;
bufferDesc.StructureByteStride = vfStride;
bufferDesc.CPUAccessFlags      = D3D11_CPU_ACCESS_WRITE;

if (FAILED(g_pd3dDevice->CreateBuffer(&bufferDesc, nullptr, &physicalBuffer))) {
    handleError(...); // handle your error here
    return;
}

Make sure that StructureByteStride is equal to the size of a structure read by the vertex shader. Also, CPU write access is required.

After that we need to create a shader resource view:

D3D11_SHADER_RESOURCE_VIEW_DESC viewDesc;
std::memset(&viewDesc, 0, sizeof(viewDesc));

viewDesc.Format              = DXGI_FORMAT_UNKNOWN;
viewDesc.ViewDimension       = D3D11_SRV_DIMENSION_BUFFER;
viewDesc.Buffer.ElementWidth = numElements;

if (FAILED(g_pd3dDevice->CreateShaderResourceView(physicalBuffer, &viewDesc, &physicalBufferView)))
{
    // TODO: error handling
    return;
}

Whew. Now let us get straight to the physical buffer filling! The algorithm is:

  1. Map the physical buffer to RAM.
  2. for each logical buffer:
  3. Calculate logical buffer offset into the physical buffer (physicalAddress field).
  4. Copy the data from the logical buffer to the mapped memory with the needed offset.
  5. Go to the next logical buffer.
  6. Unmap the physical buffer.

The code is quite simple:

// fill the physical buffer
D3D11_MAPPED_SUBRESOURCE mappedData;
std::memset(&mappedData, 0, sizeof(mappedData));

if (FAILED(g_pImmediateContext->Map(physicalBuffer, 0, D3D11_MAP_WRITE_DISCARD, 0, &mappedData)))
{
    handleError(...); // insert error handling here
    return;
}

uint8_t* dataPtr = reinterpret_cast<uint8_t*>(mappedData.pData);
size_t pageOffset = 0;
for (size_t i = 0; i < allPages.GetSize(); ++i) {
    DXLogicalMeshBuffer* logicalBuffer = allPages[i];
    // copy logical data to the mapped physical data
    std::memcpy(dataPtr + pageOffset, logicalBuffer->data, logicalBuffer->dataSize);
    // calculate physical address
    logicalBuffer->physicalAddress = pageOffset / logicalBuffer->dataFormatStride;
    // calculate offset
    pageOffset += logicalBuffer->dataSize;
}

g_pImmediateContext->Unmap(physicalBuffer, 0);

Note that rebuilding a physical buffer is a very expensive operation, in our case it is around 500ms. This slowness is caused by the high amount of data that is being sent to the GPU (tens of megabytes!). This why it is not recommended to rebuild the physical buffer often.

Full code for rebuildPages() method for reference.

Storing and rendering stuff like that requires a custom constant managing as well.

Managing per-object constants


Traditional constant buffers does not fit here for obvious reasons. That's why there is no other choice then to use one more global buffer, similar to the physical buffer described above.

Apart from usual shader constants this buffer must contain logical buffer information, geometry type (indexed and non-indexed) and vertex count.

Creating this buffer is trivial:

std::memset(&bufferDesc, 0, sizeof(bufferDesc));

bufferDesc.BindFlags           = D3D11_BIND_SHADER_RESOURCE;
bufferDesc.ByteWidth           = dataBufferSize;
bufferDesc.Usage               = D3D11_USAGE_DYNAMIC;
bufferDesc.MiscFlags           = D3D11_RESOURCE_MISC_BUFFER_STRUCTURED;
bufferDesc.StructureByteStride = stride;
bufferDesc.CPUAccessFlags      = D3D11_CPU_ACCESS_WRITE;

if (FAILED(g_pd3dDevice->CreateBuffer(&bufferDesc, nullptr, &dataBuffer))) {
    handleError(...); // handle your error here
    return;
}

D3D11_SHADER_RESOURCE_VIEW_DESC viewDesc;
std::memset(&viewDesc, 0, sizeof(viewDesc));

viewDesc.Format              = DXGI_FORMAT_UNKNOWN;
viewDesc.ViewDimension       = D3D11_SRV_DIMENSION_BUFFER;
viewDesc.Buffer.ElementWidth = numInstances;

if (FAILED(g_pd3dDevice->CreateShaderResourceView(dataBuffer, &viewDesc, &dataView))) {
    handleError(...); // handle your error here
    return;
}

First, four 32-bit registers of this buffer are filled with a shader internal data used for rendering. This data looks like this:

struct InternalData
{
    uint32_t vb;
    uint32_t ib;
    uint32_t drawCallType;
    uint32_t count;
};

After this structure goes the usual constant data used for generic mesh rendering (such as projection matrix).

Now a small digression. I usually don't render anything directly, instead I use an array of DrawCall structures, which also contain constants and all other data needed for a single DIP:

struct DrawCall final
{
    enum Type : uint32_t
    {
        Draw        = 0,
        DrawIndexed = 1
    };

    enum
    {
        ConstantBufferSize = 2048 // TODO: remove hardcode
    };

    enum
    {
        MaxTextures = 8
    };

    uint8_t constantBufferData[ConstantBufferSize];

    DXLogicalMeshBuffer* vertexBuffer;
    DXLogicalMeshBuffer* indexBuffer;

    uint32_t count;
    uint32_t startVertex;
    uint32_t startIndex;
    Type     type;
};

This is simplified to make reading easier.

The application fills an array of these structures and submits them for rendering.

After filling this draw call buffer we need to update the constant buffer, update InternalData and, finally, issue a real DIP to render stuff.

Updating constants is trivial, just loop through the command buffer and copy needed data to the right place:

// update constants
{
    D3D11_MAPPED_SUBRESOURCE mappedData;
    if (FAILED(g_pImmediateContext->Map(psimpl->constantBuffer.dataBuffer, 0, D3D11_MAP_WRITE_DISCARD,
      0, &mappedData))) {
        // TODO: error handling
        return;
    }
    uint8_t* dataPtr = reinterpret_cast<uint8_t*>(mappedData.pData);
    for (size_t i = 0; i < numInstances; ++i) {
        size_t offset = i * internal::DrawCall::ConstantBufferSize;
        const internal::DrawCall& call = queue->getDrawCalls()[i];

        std::memcpy(dataPtr + offset, call.constantBufferData, internal::DrawCall::ConstantBufferSize);

        // fill internal data structure
        InternalData* idata = reinterpret_cast<InternalData*>(dataPtr + offset);

        DXLogicalMeshBuffer* vertexBuffer = static_cast<DXLogicalMeshBuffer*>(call.vertexBuffer.value);
        if (vertexBuffer != nullptr)
            idata->vb = vertexBuffer->physicalAddress;

        DXLogicalMeshBuffer* indexBuffer = static_cast<DXLogicalMeshBuffer*>(call.indexBuffer.value);
        if (indexBuffer != nullptr)
            idata->ib = indexBuffer->physicalAddress;

        idata->drawCallType = call.type;
        idata->count        = call.count;
    }
    g_pImmediateContext->Unmap(psimpl->constantBuffer.dataBuffer, 0);
}

The data is now ready for actual rendering.

Shader and drawing


Time for drawing! To render everything we need to set the buffers and issue DrawInstanced:

ID3D11ShaderResourceView* vbibViews[2] = {
    g_physicalVertexBuffer->physicalBufferView,
    g_physicalIndexBuffer->physicalBufferView
};

g_pImmediateContext->VSSetShaderResources(0, 2, vbibViews);

g_pImmediateContext->VSSetShaderResources(0 + 2, 1, &psimpl->constantBuffer.dataView);
g_pImmediateContext->HSSetShaderResources(0 + 2, 1, &psimpl->constantBuffer.dataView);
g_pImmediateContext->DSSetShaderResources(0 + 2, 1, &psimpl->constantBuffer.dataView);
g_pImmediateContext->GSSetShaderResources(0 + 2, 1, &psimpl->constantBuffer.dataView);
g_pImmediateContext->PSSetShaderResources(0 + 2, 1, &psimpl->constantBuffer.dataView);

g_pImmediateContext->DrawInstanced(maxDrawCallVertexCount, numInstances, 0, 0);

Almost done. A few notes:
  • DrawInstanced needs to be called with a maximum amount of vertices the command buffer has. This is required because we have a single draw call and several meshes. Meshes can have different amount of vertices/indices and this needs to be taken into account. I suggest to render the maximum amount of vertices and dicard redunand vertices by sending them outside the clip plane.</il>
  • This introduces some additional vertex shader overhead, thus you need to carefully watch for the difference between maximum and minimun vertices being within a reasonable range (typically 10% difference is OK). Remember that these wasted vertices add overhead to each rendered instance and it grows insanely fast. Watch for the artists!
  • One DrawInstanced call can handle both indexed and non-indexed geometry, because this is handled in the vertex shader.TriangleStrip, TriangleFan and similar topologies are not supported for obvious reasons. This method supports only *List topologies (TriangleList, PointList, etc.)
The vertex shader is also very simple.

First we need to define all the CPU-side structured (vertex format, constant format, etc.):

// vertex
struct VertexData
{
    float3 position;
    float2 texcoord0;
    float2 texcoord1;
    float3 normal;
};
StructuredBuffer<VertexData> g_VertexBuffer;
StructuredBuffer<uint>       g_IndexBuffer;

// pipeline state
#define DRAW 0
#define DRAW_INDEXED 1
struct ConstantData
{
    uint4    internalData;

    float4x4 World;
    float4x4 View;
    float4x4 Projection;
};
StructuredBuffer<ConstantData> g_ConstantBuffer;

After that goes the code that fetches constant data and processes vertices (pay attention to indexed/non-indexed geometry handling):

uint instanceID = input.instanceID;
uint vertexID   = input.vertexID;

uint vbID      = g_ConstantBuffer[instanceID].internalData[0];
uint ibID      = g_ConstantBuffer[instanceID].internalData[1];
uint drawType  = g_ConstantBuffer[instanceID].internalData[2];
uint drawCount = g_ConstantBuffer[instanceID].internalData[3];

VertexData vdata;
[branch] if (drawType == DRAW_INDEXED) vdata = g_VertexBuffer[vbID + g_IndexBuffer[ibID + vertexID]];
else     if (drawType == DRAW)         vdata = g_VertexBuffer[vbID + vertexID];

[flatten] if (vertexID > drawCount)
    vdata = g_VertexOutsideClipPlane; // discard vertex by moving it outside of the clip plane

As you can see - there is no rocket science. Full shader code for reference.

An attentive reader will notice that I did not cover texturing. The next part is about it.

What shall we do with textures?


This is the biggest con of this method. With this approach it is highly desired to have unique textures per instance, but implementing this with D3D11 is problematic.

Possible solutions:
  • Use one texture atlas. Cons: One atlas cannot hold many textures, so you will need to batch instances by 3 or 4 and render them separately. This negates all the pros of this method.
  • Use texture arrays (Texture2DArray, Sampler2DArray). Cons: better then texture atlas, but still limited to 512 textures per array.
  • Switch to OpenGL 4.3 with bindless textures. Cons: everything will fit, but there is one serious problem called OpenGL.
  • Switch to D3D12/Mantle/Vulkan/etc. Cons: everything will fit, but with limited hardware/OS support.
  • Virtual textures. Cons: virtual textures, anyone?:)
Detailed overview of all these methods goes beyond this article. I will only say that I use texture arrays for D3D11 and native features of D3D12.

Caveats and limitations


All major cons are described above, thus here is a little summary:
  • Wasted vertices overhead.
  • Indirection overhead: vertex and constant access is badly predicted, because it is a random access, thus they are not cached and always calculated dynamically. Indexed rendering is the slowest one because of double indirection.
  • Not all primitive topologies supported.
  • Unique textures per instance are not possible in the general case.
  • Reallocating buffers is expensive and adds video memory fragmentation.
  • Unusual vertex buffers require unusual algorithms for unusual cases, like dynamically generating vertices with compute shader (e.g. water simulation, cloth, etc.).
  • It is required to hold all the logical buffer data in memory, this slightly increasing application memory consumption.

Demo and sources


The main source code for this method is here. There is no binary version at the moment.

Here are some screenshots:


16384 unique cubes, 1.2ms per frame on Intel HD 4400:
Attached Image: dvp_cubes.png

4096 unique instances of grass, 200k triangles:
Attached Image: dvp_grass.png


Further reading


OpenGL Insights, III Bending the Pipeline, Programmable vertex pulling by Daniel Rakos - almost the same method for OpenGL.

Thanks for your attention!

27 April 2015: Initial release

Automata, Virtual Machines and Compilers

$
0
0
Greetings! I'm about to step into a bit larger topic that does not seem to be related to games directly, but it actually is. The whole topic is about automata, virtual machines and compilers (and not just about them!).

The topic is large, that is why it will not be included whole inside a single article, anyways after each article I would like to provide code that one can run and that is easy to understand.

What knowledge do you need to understand this article? You definitely need to know something about programming. Some knowledge of automata and assembler is also welcome. And of course you need your favourite programming language to work in.

In the first article I would like to demonstrate the basics behind simple math expressions, very basic theory behind compilers, disassemblers and computation machines.

Formal Definitions


Language Definition


In the beginning we need to define our language. For start it is going to be fairly simple (hopefully we are going to extend it further) and our expressions will only consist of numbers (integer values), operators (for the beginning we're fine with +, -, * and /) and parentheses.

Backus-Naur Form


For language definition we are going to use so-called BNF (Backus-Naur Form) which is a method to describe context-free grammar. The form is actually set of simple rules written as:

<symbol> ::= expression

Where the value on left side is a non-terminal symbol, and on the right side there is a set of terminal symbols (if any) followed by non-terminal symbols (if any). On the right side we can have multiple expressions separated using | (which means we can replace the non-terminal on the left with one of the expressions on the right).

Parts of the expression can be enclosed in '[' and ']' brackets followed by '*' (which means that this expression is repeated N times, where N >= 0), or '+' (which means that this expression is repeated N times, where N >= 1), or '^N' where N is a number (which means that this expression is repeated exactly N times).

An example language is:

<integer> ::= [0..9]+
<add_operation> ::= + | -
<mul_operation> ::= * | /
<factor> ::= (<expression>) | <integer>
<term> ::= <factor> [<mul_operation> <factor>]*
<expression> ::= <term> [<add_operation> <term>]*

Automata


With this grammar, we can generate any possible expression that is valid in the language, which is great, but... we do not need to generate all valid inputs of our language, that will be left for the user, we need to accept the language and during that process it is needed to generate the code that is simple enough for some sort of virtual machine to execute.

As the language is context-free, it is possible to use a recursive descent parser to accept (e.g. it is valid expression) or reject (e.g. it is invalid expression) the input. I'm not going to write too much about parsers in the series - I challenge users to try writing them.

Of course you are free to use Flex or any other generator (but I do not recommend this, unless you know how exactly you would parse something - these production tools are awesome, but only when you know how the actual parsing works).

What is a recursive descent parser? It is a top-down parser, built from mutually recursive procedures. Each of these procedures implements often one (and sometimes more) of productions of the grammar it recognizes. The exciting thing about this is that it closely resembles BNF!

Compilation and Execution


This is a process of producing machine code from some other language. Let me present a simple abstraction here, let us have a 'program':

"Compute three plus four"

Such sentence is, well... not really useful, we need to translate it into something we can work with. One of such formal languages is math. If we translate such sentence into:

3+4

We know a way to compute it (there are multiple computation models how to compute this), let me present one:

MOVE reg0 3
MOVE reg1 4
ADD reg0 reg1
PRINT reg0

Having a machine with 2 registers, allowing for 3 instructions, where:
  • Instruction MOVE takes 2nd argument (value) and moves it into 1st argument.
  • Instruction ADD takes value stored in register in 2nd argument and adds it to value stored in register in 1st argument
  • Instruction PRINT prints the value in 1st argument onto screen
Execution process of such program will work as following:

INSTRUCTION | REGISTERS [] | SCREEN []
              [-, -]       | []
MOVE reg0 3   [3, -]       | []
MOVE reg1 4   [3, 4]       | []
ADD reg0 reg1 [7, 4]       | []
PRINT reg0    [7, 4]       | [7]

Such approach is known as imperative execution (we are giving orders to computing machine of what to do). This paradigm has one large advantage over other variants of execution: it is rather simple to make a machine that executes imperative language.

Simple calculator


Let us begin with something simple, and what is the most simple language we can imagine? It is a calculator of course! Our goal is to be able to handle 4 operators (+, -, * and /), parentheses and integer numbers.

So, let us formally define a language in BNF.

<integer> ::= [0..9]+
<add_operation> ::= + | -
<mul_operation> ::= * | /
<factor> ::= (<expression>) | <integer>
<term> ::= <factor> [<mul_operation> <factor>]*
<expression> ::= <term> [<add_operation> <term>]*

Note: such language is exactly the one in the previous example.

Compiler


These 6 rules are to be rewritten into the source, I'm going to provide pseudo-code here (you can see full working code in accompanying project). Let us start with Integer, what we want to do when we hit an integer - well that is simple, we want to put its value into the register (e.g. somewhere where we can further work with it):

Note that in our assembly we move the right value or register into left one. Also after each operation, the result is stored in left register.

Integer()
{
	printLine("mov.reg.i32 r0 %s", GetValue());
}

Where GetValue is just a function that takes next token from stream, validates whether it is an integer (containing only 0..9). Such function can look like following:

GetValue()
{
    string output;
    int i = 0;
    string token = GetNextToken(); // Gets current token and moves to next
    do
    {
        if (token[i] in [0..9])
        {
            output += token[i];
        }
    }
    while (i < token.length);
    Match();
    return output;
}

Note. for '+' (e.g. at least one repetition) we use a do-while construct. I'm intentionally going to skip add_operation and mul_operation rules and jump over to Factor.

Factor()
{
	if (NextToken is LEFT-PARENTHESIS)
	{
		Match(LEFT-PARENTHESIS); // Eats current token, matches it against argument and goes to next token
		Expression();
		Match(RIGHT-PARENTHESIS); // Eats current token, matches it against argument and goes to next token
	}
	else
	{
		Integer();
	}
}

This was quite obvious - in parentheses we always have another expression, outside we have just an integer. The following two Term and Expression are the interesting ones:

Term()
{
	Factor();

	while (NextToken is MULTIPLICATION | DIVISION)
	{
		printLine("push.i32 r0");
		if (NextToken is MULTIPLICATION))
		{
			Match(MULTIPLICATION); // Eats current token, matches it against argument and goes to next token
			Factor();
			printLine("pop.i32 r1");
			printLine("mul.i32 r0 r1");
		}
		else if (NextToken is DIVISION)
		{
			Match(DIVISION); // Eats current token, matches it against argument and goes to next token
			Factor();
			printLine("pop.i32 r1");
			printLine("div.i32 r1 r0");
			printLine("mov.reg.reg r0 r1");
		}
		else if (NextToken is NULL) // If there is no next token
		{
            // Crash compilation and print error
			Expected("Expected multiplication or division operation");
		}
	}
}

Expression()
{
	Term();

	while (NextToken is ADDITION | SUBTRACTION)
	{
		printLine("push.i32 r0");
		if (NextToken is ADDITION)
		{
			Match(ADDITION); // Eats current token, matches it against argument and goes to next token
			Term();
			printLine("pop.i32 r1");
			printLine("add.i32 r0 r1");
		}
		else if (NextToken is SUBTRACTION)
		{
			Match(SUBTRACTION); // Eats current token, matches it against argument and goes to next token
			Term();
			printLine("pop.i32 r1");
			printLine("sub.i32 r0 r1");
			printLine("neg.i32 r0");
		}
		else if (NextToken is NULL) // If there is no next token
		{
            // Crash compilation and print error
			Expected("Expected addition or subtraction operation");
		}
	}
}

What happens here? I know it can seem confusing at first - but we are doing exactly what BNF rule says to us. Note that we handled add_operation/mul_operation here in the while condition and based upon what operation we encountered we do different things.

Actually we started working with operator precedence (that is why we always push the register value onto stack and pop it prior to working with that), the rest should be clear. Addition and subtraction instructions are inside Expression because they are lower priority compared to multiplication and division handled in Term (in recursion, the deeper we are, the higher the operator precedence) - so resolving inside parentheses and actual values have the highest precedence, multiplication and division are in the middle and addition and subtraction have the lowest precedence.

I know this is not the clearest thing to understand, and I highly encourage you to try running the compiler in debug mode so you can actually see what is happening (and that precedence is solved correctly in this way).

When implementing the compiler like this and running on some input like:

(3 + 4 * (7 - 2)) / 2

We obtain assembly:

mov.reg.i32 r0 3
push.i32 r0
mov.reg.i32 r0 4
push.i32 r0
mov.reg.i32 r0 7
push.i32 r0
mov.reg.i32 r0 2
pop.i32 r1
sub.i32 r0 r1
neg.i32 r0
pop.i32 r1
mul.i32 r0 r1
pop.i32 r1
add.i32 r0 r1
push.i32 r0
mov.reg.i32 r0 2
pop.i32 r1
div.i32 r1 r0
mov.reg.reg r0 r1

Let us demonstrate what the execution would look like (by stack we mean LIFO stack):

mov.reg.i32 r0 3  // Registers [ 3,  -] Stack []
push.i32 r0       // Registers [ 3,  -] Stack [ 3]
mov.reg.i32 r0 4  // Registers [ 4,  -] Stack [ 3]
push.i32 r0       // Registers [ 4,  -] Stack [ 3, 4]
mov.reg.i32 r0 7  // Registers [ 7,  -] Stack [ 3, 4]
push.i32 r0       // Registers [ 7,  -] Stack [ 3, 4, 7]
mov.reg.i32 r0 2  // Registers [ 2,  -] Stack [ 3, 4, 7]
pop.i32 r1        // Registers [ 2,  7] Stack [ 3, 4]
sub.i32 r0 r1     // Registers [-5,  7] Stack [ 3, 4]
neg.i32 r0        // Registers [ 5,  7] Stack [ 3, 4]
pop.i32 r1        // Registers [ 5,  4] Stack [ 3]
mul.i32 r0 r1     // Registers [20,  4] Stack [ 3]
pop.i32 r1        // Registers [20,  3] Stack []
add.i32 r0 r1     // Registers [23,  3] Stack []
push.i32 r0       // Registers [23,  3] Stack [23]
mov.reg.i32 r0 2  // Registers [ 2,  3] Stack [23]
pop.i32 r1        // Registers [ 2, 23] Stack []
div.i32 r1 r0     // Registers [ 2, 11] Stack []
mov.reg.reg r0 r1 // Registers [11, 11] Stack []

I recommend to check a few more examples and hand-compute the registers and stack value on the run. It will definitely help to understand that operator precedence will work here and how the calculator works.

Disassembler


While I already mentioned how the computation works, I don't really recommend writing a virtual machine and processing strings. We can do better!

Performing very simple disassembly and storing everything in binary form is a far better way - all you need is to think of the opcodes for your instructions, assign IDs to your registers and store all these numbers into binary form.

Note that this way you can actually perform disassembly into x86 or x64 if you wish, but that is not necessary. Implementing a disassembler is very straight-forward and I recommend to look into accompanying source code, even though the implementation in there is not highly effective, it is easy to understand.

Virtual Machine


Up to here, we could only execute the code "by hand", but that ends now!

What our virtual machine needs? It needs some memory where we can store stack and the actual code that is to be executed, and at least 4 registers - as our code is working with 2 (r0 and r1) and 2 more, one for stack pointer (as we need stack as temporary memory for our computation) and one for instruction pointer (so we know what we are executing right now).

Now, we read (in binary) our application to the memory, place instruction pointer to the address where there is beginning of our application and stack pointer right after the end of or application in memory. E.g.:

|O|U|R|_|A|P|P|L|I|C|A|T|I|O|N|_|S|O|U|R|C|E|_|C|O|D|E| | | | | | | | | | | |
 |                                                     |
 IP                                                    SP

Where IP represents memory address where instruction pointer points to, and SP represents memory address were stack pointer points to. E.g. in this case our IP=0 and our SP=27.

As each sub-computation stores result into R0 (register 0), the result of the whole computation will be also in register 0. Note that I'm actually printing both registers in the accompanying source code, once computation finishes.

Conclusion


The article showed basic principles in automata theory, formal languages and compilers. I know it wasn't too much and creating something useful out of this might take a lot more effort and time. Compilers aren't easy stuff, and there is not many recent articles about them.

If the time allows, I'd be very glad to continue step-by-step adding more and more features into this little compiler, eventually making it useful. For next time, I promise to talk about types!

Accompanying source code demonstrating sample implementation.
Attached File  Compiler1.rar   118.89KB   85 downloads

XRay Unreal Engine 4.5 source code

$
0
0
The Unreal Engine is a game engine developed by Epic Games, first showcased in the 1998 first-person shooter game Unreal. Although primarily developed for first-person shooters, it has been successfully used in a variety of other genres, including stealth, MMORPGs, and other RPGs.

Its code is written in C++ and it's used by many game developers today. Its source code is available for free from GitHub. Many amazing games were developed using this engine, it permits developers to produce very realistic renderings like this one.

488-unreal-engine-4.jpg

What's the source code executed behind the scene to produce this realistic rendering?

It's very interesting to go inside this powerful game engine and discover how it's designed and implemented. C++ developers could learn many good practices from its code base.

Let's XRay its source code using CppDepend and CQLinq to explore some design and implementation choices of its developement team.

1- Namespaces


Unreal Engine uses namespaces widely for three main reasons:
  • Many namespaces contain only enums as shown by this following CQLinq query, which gives us the ones containing only enums.
unreal2.png

In a large project, you would not be guaranteed that two distinct enums don't both get called with the same name. This issue was resolved in C++11, using enum class which implicitly scope the enum values within the enum's name.
  • Anonymous namespace: Namespace with no name avoids making global static variable. The “anonymous” namespace you have created will only be accessible within the file you created it in. Here it is the list of all anonymous namespaces used:
unreal3.png
  • Modularizing the code base: Let's search for all the other namespaces, i.e. neither the anonymous ones nor the ones containing only enums:
unreal6.png

The namespaces represent a good solution to modularize the application; Unreal Engine defines more than 250 namespaces to enforces its modularity, which makes the code more readable and maintainable.

2- Paradigm used


C++ is not just an object-oriented language. As Bjarne Stroustrup points out, “C++ is a multi-paradigmed language.” It supports many different styles of programs, or paradigms, and object-oriented programming is only one of these. Some of the others are procedural programming and generic programming.


2-1 Procedural Paradigm


2-1-1 Global functions


Let’s search for all global functions defined in the Unreal Engine source code:


unreal7.png

We can classify these functions in three categories:


1 - Utility functions: For example 6344 of them concern Z_Construct_UXXX functions, which are used to create instances needed by the engine.


unreal8.png


2 - Operators: Many operators are defined as it is shown, by the result of this CQLinq query:


unreal9.png


Almost all kinds of operators are implemented in the Unreal Engine source code.


3 - Functions related to the engine logic: Many global functions containing some engine treatments are implemented. Maybe these kinds of functions could be grouped by category, as static methods into classes, or grouped in namespaces.


2-1-2 Static global functions:


It's a best practice to declare a global function as static unless you have a specific need to call it from another source file.


unreal10.png


Many global functions are declared as static, and as specified before, other global functions are defined inside anonymous namespaces


2-1-3 Global functions candidate to be static.


Global not exported functions, not defined in an anonymous namespace and not used by any method outside the file where they were defined. These are good candidates to be refactored to be static.


unreal65.png


As we can observe some global functions are candidates to be refactored to be static.


2-2 Object Oriented paradigm


2-2-1 Inheritance


In object-oriented programming (OOP), inheritance is a way to establish Is-a relationship between objects. It is often confused as a way to reuse the existing code which is not a good practice because inheritance for implementation reuse leads to Tight Coupling. Re-usability of code is achieved through composition (Composition over inheritance). Let’s search for all classes having at least one base class:

unreal13.png


And to have a better idea of the classes concerned by this query, we can use the Metric View.


In the Metric View, the code base is represented through a Treemap. Treemapping is a method for displaying tree-structured data by using nested rectangles. The tree structure used in a CppDepend treemap is the usual code hierarchy:

  • Projects contain namespaces.
  • Namespaces contain types.
  • Types contain methods and fields.

The treemap view provides a useful way to represent the result of a CQLinq request; the blue rectangles represent this result, so we can visually see the types concerned by the request.


unreal12.png


As we can observe, the inheritance is widely used in the Unreal Engine source code.


Multiple Inheritance: Let's search for classes inheriting from more than one concrete class.


unreal15.png


The multiple inheritance is not widely used, only a few classes inherit from more than one class.


2-2-2 Virtual methods


Let's search for all virtual methods defined in the Unreal Engine source code:


unreal19.png


Many methods are virtual, and some of them are pure virtual:


unreal21.png


As with the procedural paradigm, the OOP paradigm is also widely used in the Unreal Engine source code. What about the generic programming paradigm?


2-3 Generic Programming


C++ provides unique abilities to express the ideas of Generic Programming through templates. Templates provide a form of parametric polymorphism that allows the expression of generic algorithms and data structures. The instantiation mechanism of C++ templates insures that when a generic algorithm or data structure is used, a fully-optimized and specialized version will be created and tailored for that particular use, allowing generic algorithms to be as efficient as their non-generic counterparts.


2-3-1 Generic types:


Let's search for all genric types defined in the engine source code:


unreal23.png


Only a few types are defined as generic. Let's search for generic methods:


unreal26.png


More than 40000 methods are generic; they represent more than 25% of the methods implemented.

To resume the Unreal Engine source code, mix between the three paradigms.

3- PODs to define the data model


In object-oriented programming, plain old data (POD) is a data structure that is represented only as passive collections of field values (instance variables), without using object-oriented features. In computer science, this is known as passive data structure

Let's search for the POD types in the Unreal Engine source code

unreal28.png

More than 2000 types are defined as POD types, many of them are used to define the engine data model.

4- Gang Of Four design patterns


Design Patterns are a software engineering concept describing recurring solutions to common problems in software design. Gang of four patterns are the most popular ones. Let's discover some of them used in the Unreal Engine source code.

4-1 Singleton

The singleton is the most popular and the most used one. Here are some singleton classes defined in the source code:

unreal29.png

TThreadSingleton is a special version of singleton. It means that there is created only one instance for each thread. Calling its method Get() is thread-safe.

4-2 Factory

Using factory is interesting to isolate the logic instantiation and enforces the cohesion; here is the list of factories defined in the source code:

unreal30.png

And here's the list of the abstract ones:

unreal31.png

4-3 Observer

The observer pattern is a software design pattern in which an object maintains a list of its dependents, called observers, and notifies them automatically of any state changes, usually by calling one of their methods.

They are some observers implemented in its source code, FAIMessageObserver is one of them.

Here's a dependency graph to show the call of the OnMessage method of this observer:

unreal70.png

4-4 Command

The command pattern is a behavioral design pattern in which an object is used to represent and encapsulate all the information needed to call a method at a later time.

Four terms always associated with the command pattern are command, receiver, invoker and client. A command object has a receiver object and invokes a method of the receiver in a way that is specific to that receiver's class.

Here's for example all commands inheriting from the IAutomationLatentCommand:

unreal33.png

5- Coupling and Cohesion


5-1 Coupling

Low coupling is desirable because a change in one area of an application will require fewer changes throughout the entire application. In the long run, this could alleviate a lot of time, effort, and cost associated with modifying and adding new features to an application.


Low coupling could be acheived by using abstract classes or using generic types and methods.


Let’s search for all abstract classes defined in the Unreal Engine source code :


unreal34.png

Only a few types are declared as abstract. The low coupling is more enforced by using generic types and generic methods.

Here's for example the methods using at least one generic method:

unreal27.png

As we can observe many methods use the generic ones, the low coupling is enforced by the function template params. Indeed the real type of these parameters could change without changing the source code of the method called.

5-2 Cohesion

The single responsibility principle states that a class should not have more than one reason to change. Such a class is said to be cohesive. A high LCOM value generally pinpoints a poorly cohesive class. There are several LCOM metrics. The LCOM takes its values in the range [0-1]. The LCOM HS (HS stands for Henderson-Sellers) takes its values in the range [0-2]. A LCOM HS value higher than 1 should be considered alarming. Here are how to compute LCOM metrics:

LCOM = 1 – (sum(MF)/M*F)
LCOM HS = (M – sum(MF)/F)(M-1)

Where:

  • M is the number of methods in class (both static and instance methods are counted, it includes also constructors, properties getters/setters, events add/remove methods).
  • F is the number of instance fields in the class.
  • MF is the number of methods of the class accessing a particular instance field.
  • Sum(MF) is the sum of MF over all instance fields of the class.

The underlying idea behind these formulas can be stated as follows: a class is utterly cohesive if all its methods use all its methods use all its instance fields, which means that sum(MF)=M*F and then LCOM = 0 and LCOMHS = 0.


LCOMHS values higher than 1 should be considered alarming.


unreal36.png


Only some types are considered as not cohesive.


6- Immutability, Purity and side effect


6-1 Immutable types

Basically, an object is immutable if its state doesn’t change once the object has been created. Consequently, a class is immutable if its instances are immutable.


There is one important argument in favor of using immutable objects: It dramatically simplifies concurrent programming. Think about it, why is writing proper multithreaded programming a hard task? Because it is hard to synchronize threads access to resources (objects or others OS resources). Why is it hard to synchronize these accesses? Because it is hard to guarantee that there won’t be race conditions between the multiple write accesses and read accesses done by multiple threads on multiple objects. What if there are no more write accesses? In other words, what if the state of the objects accessed by threads, doesn’t change? There is no more need for synchronization!


Another benefit of immutable classes is that they can never violate LSP (Liskov Subtitution Principle) , here’s a definition of LSP quoted from its wiki page:
Liskov’s notion of a behavioral subtype defines a notion of substitutability for mutable objects; that is, if S is a subtype of T, then objects of type T in a program may be replaced with objects of type S without altering any of the desirable properties of that program (e.g., correctness).

Here's the list of immutable types defined in the source code:

unreal38.png

6-2 purity and side effect

The primary benefit of immutable types come from the fact that they eliminate side-effects. I couldn’t say it better than Wes Dyer so I quote him:

We all know that generally it is not a good idea to use global variables. This is basically the extreme of exposing side-effects (the global scope). Many of the programmers who don’t use global variables don’t realize that the same principles apply to fields, properties, parameters, and variables on a more limited scale: don’t mutate them unless you have a good reason.(…)

One way to increase the reliability of a unit is to eliminate the side-effects. This makes composing and integrating units together much easier and more robust. Since they are side-effect free, they always work the same no matter the environment. This is called referential transparency.

Writing your functions/methods without side effects - so they're pure functions, i.e. not mutate the object - makes it easier to reason about the correctness of your program.

Here's the list of all methods without side-effects

unreal41.png

More than 125 000 methods are pure.

7- Implementation quality


7-1 Too big methods


Methods with many number of lines of code are not easy to maintain and understand. Let’s search for methods with more than 60 lines.


unreal44.png


Unreal Engine source code contains more than 150 000 methods, so less than 1% could be considered as too big.


7-2 Methods with many parameters


unreal45.png


Few methods have more than 8 parameters, most of them are generic, to avoid defining variadic functions, like the case of TCStringt::Snprintf methods.


7-3 Methods with many local variables


unreal46.png


Less than 1% have many local variables.


7-4 Methods too complex


Many metrics exist to detect complex functions, NBLinesOfCode, Number of parameters and number of local variables are the basic ones.


There are other interesting metrics to detect complex functions:

  • Cyclomatic complexity is a popular procedural software metric equal to the number of decisions that can be taken in a procedure.
  • Nesting Depth is a metric defined on methods that is relative to the maximum depth of the more nested scope in a method body.
  • Max Nested loop is equals the maximum level of loop nesting in a function.

The max value tolerated for these metrics depends more on the team choices, there are no standard values.


Let’s search for methods that could be considered as complex in the Unreal Engine code base.


unreal49.png


Only 1.5% are candidate to be refactored to minimize their complexity.


7-4 Halstead complexity

Halstead complexity measures are software metrics introduced by Maurice Howard Halstead in 1977. Halstead made the observation that metrics of the software should reflect the implementation or expression of algorithms in different languages, but be independent of their execution on a specific platform. These metrics are therefore computed statically from the code.

Many metrics were introduced by Halstead, let's take as example the TimeToImplement one, which represents the time required to program a method in seconds.

unreal50.png

1748 methods require more than one hour to be implemented.

8- RTTI


RTTI refers to the ability of the system to report on the dynamic type of an object and to provide information about that type at runtime (as opposed to at compile time). However, RTTI has become controversial within the C++ community. Many C++ developers choose to not use this mechanism.

What about Unreal Engine developers team?

unreal60.png

No method uses the dynamic_cast keyword, The Unreal Engine team chose to not use the RTTI mechanism.

9- Exceptions


Exception handling is also another controversial C++ feature. Many known open source C++ projects do not use it.

Let's search whether in the Unreal Engine source code an exception was thrown.

unreal62.png

Exceptions are thrown in some methods; let's take as example the RaiseException one:

unreal61.png

As specified in their comments, the exception could be generated for the header tool, but in normal runtime code they don't support exception handling.

10- Some final statistics


10-1 most popular types

It’s interesting to know the most used types in a project; indeed these types must be well designed, implemented and tested. And any change occuring to them could impact the whole project.

We can find them using the TypesUsingMe metric:

unreal71.png

However there's another interesting metric to search for popular types: TypeRank.

TypeRank values are computed by applying the Google PageRank algorithm on the graph of types’ dependencies. A homothety of center 0.15 is applied to make it so that the average of TypeRank is 1.

Types with high TypeRank should be more carefully tested because bugs in such types will likely be more catastrophic.

Here’s the result of all popular types according to the TypeRank metric:

unreal52.png

10-2 Most popular methods

unreal54.png

10-3 Methods calling many other methods

It’s interesting to know the methods using many other ones, It could reveal a design problem in these methods. And in some cases a refactoring is needed to make them more readable and maintainable.

unreal57.png

Improve Player Retention Reacting to Behavior [Server Scripts]

$
0
0
Picture this. After you’ve fought hard to release your game and you’re lucky enough to get a pretty decent number of users downloading your game, they get tangled up in Level #8 and can’t manage to get past it.

According to your analytics service, they seemed to be enjoying the game so far, but now the users are logging in at a lower rate. You’re losing active users. What’s going on?

There’s no question they like your game. Why would they play up to Level #8 if they didn’t? The thing is maybe you overestimated the user's ability to reach enough proficiency in the game to advance to further levels. Level #8 might be too difficult for most users and that’s why they are no longer logging in to the game. Thus, you’re losing users.

There are many solutions to the problem. You could reduce the number of enemy waves, add player stamina, change the timing of the game or add more game levels before they get to Level #8, allowing users to be more game-savvy by then.

You do what you have to do


Ok, you decide to modify the game’s parameters to ease it on your users so they keep on enjoying the game and choose to stay. Say you’re a programming beast and that you’re able to swiftly adjust the code and successfully test the game mechanics in one day. That’s good and all but you still need Google Play or the App Store to approve it and publish it - a day for the former and a whopping 7 days for the latter.

The lack of control over the response time for the in-game modifications hampers your ability to make the game progress. I don’t want to be a bummer, but you’re still losing users.

Having passed the period of time for the changes to go live - which seemed longer than you care to admit - users still have to accept to download the latest version of the game. Some of them do it right away, some might do it at a later time… or never at all. After all that rush to get the newest version active, it is still up to your game users having the latest version if you want to see whether the fixes have a positive effect.

Right, you continue losing users.

It’s really hard to get good feedback from the users - and react accordingly - when not all of them are running the latest version.


water-slide.jpg


You can turn it around


The use of external servers to store game mechanics data is a rapidly increasing tendency among game developers. Offering flexibility and a quick response is key to be adaptable to the needs of your users. Imagine a service that cuts your response time to a minimum, gives uninterrupted game play to your users and lets you test different approaches at the same time.

Why store parameters in an external server


#1 Never let others dictate your response time

Your response time shouldn’t be much longer than what you spend on tweaking your code. Fixing it to have the changes go live barely at the same time, you’ll be able to deliver a quicker response to your users’ needs and keep them engaged. Getting user data faster allows you to decide if the changes came to effect or if you need another iteration of changes.

#2 Don’t annoy users with a game update download

Having your users experience the updated game on-the-go releases their need to download any game updates manually. They’ll always play the latest version of the game so you’ll get very reliable user data because there won’t be different versions running at the same time.

#3 Find solutions on-the-go

Upload different solutions to the same problem to simultaneously test which one performs better among users. Split testing subtle code differences will return twice as many data, which means reducing the time you spend to find the best adjustments for the game.

Server side scripts allow maximum configurability


Take this as an example. You could create a config collection in the server side to keep a simple config JSON. This would be the code for it.

{
"levels":
{
"1": { "difficulty": 1, "time": 60 },
"2": { "difficulty": 3, "time": 70 },
"3": { "difficulty": 5, "time": 80 },
"4": { "difficulty": 7, "time": 90 },
"5": { "difficulty": 9, "time": 100 },
},
"adsplatform": "iads",
"coinseveryday":
{ "1": 10, "2": 20, "3":30, "4": 60, "5": 100 }
}

Every time a user opens a new game session you can check if this config has been changed or not. If it has, it’ll start the download of the new game’s config and will start using them right away.

Besides, you can also implement A/B testing with one custom script very easily.
  • Create two or three JSON config samples in the collection.
  • Define a custom script - new server function - called getGameParameters.
  • Call this function every time a user logs in to your game.
This function will be a simple Javascript - using a round robin technique - that will decide what JSON has to be sent: A, B or C. This way the decision point is on server side, can be easily changed and you will be able to test different simultaneous configurations to get better results.

Now you know you can improve user experience storing game mechanics in the server side, what other situations do you think you could use this for your game?

I'd like to know! Leave a comment.


This was originally posted in Gamedonia blog.

The Good, The Bad and The WebGL-y

$
0
0
The online world is in the midst of a major evolution. Old HTML ways are making way for the new, improved and interactive world of HTML5 and WebGL. The excitement of the static internet has long-since settled down, allowing visionaries a clear view of what the future of online means to consumers and developers. The future of online is fun and games, the future is immersive and interactive, the future is WebGL.

ThreeJS was my first venture into WebGL.


ThreeJS caught my attention because it allowed games to be built directly into a browser with no need for plugins. While great in theory, there was a huge learning curve and 3JS, in its current state, is the toy of elite coders and is pretty much inaccessible for someone wanting to implement simple WebGL into their current online presence.


Attached Image: 2014-10-13a-instruments.jpg
Import test of the instruments from "The Music of Junk".


By following tutorials and opening up working examples, I was able to create many successful tests, but eventually hit a road block. When it came to getting animated characters into the browser via 3JS, I was unable to wrap my drummer's mind around the code to make it work. Relief to my frustration appeared in the file format of Sea3D, which allowed for very easy export of character models from 3ds Max into the 3JS world.


Attached Image: elvisCollideWalls-KEEP-01.jpg
Hit box and physics test


So far as I know, 3JS does not have a GUI to work with, it's all back-end code to bring models into the scene. While that worked great once I figured out the code, I eventually lost interest when I was unable to make walls impassable. Soon after, I put 3JS to the side and took on other projects to entertain myself.

A short stop with X3Dom.


A little while later, I got a new job and was given some freedom to experiment for marketing. I messed a bit with 3JS and product displays, but was hindered by quality and file size. In the time between my venture into 3JS and my new job, I had abandoned 3ds Max, as I no longer had a system capable of running it. In November 2013, I decided to take up 3d again, and since enough time had passed that I would basically have to relearn 3ds Max, I decided to learn Blender instead. Thus, I reached another roadblock when wanting to work with 3JS, as the Sea3D character export only works for 3dsMax, and the developer never got around to the promised Blender Exporter.

Basic X3Dom embed code
  <head>
    <meta http-equiv='Content-Type' content='text/html;charset=utf-8'></meta>
    <link rel='stylesheet' type='text/css' href='http://www.x3dom.org/x3dom/release/x3dom.css'></link>
    <script type='text/javascript' src='http://www.x3dom.org/x3dom/release/x3dom.js'></script>
  </head>
  <body>
    <x3d id='someUniqueId' showStat='false' showLog='false' x='0px' y='0px' width='400px' height='400px'>
      <scene>Some Info About Your Model
        <inline url='yourModel.x3d' ></inline>
      <scene>
    </x3d>
  </body>          

Blender comes equipped with the exporter for X3Dom file format, a great file system for product visualization, but hampered by file size and quality issues, like wireframe edges showing up in rendered models. With the limits of X3Dom and the dead end of 3JS when working with Blender, I figured I would have to wait for a dedicated development team to come along and take up the WebGL cause.

That team arrived in the form of Blend4Web.


Attached Image: godzilla.jpg
Quick Godzilla Test


Blend4Web is where I currently sit watching the World Wide WebGL take shape in function, design and, most important to me, fun implementation of this new tech. While fully capable of making games that run entirely in a browser with no plugins required, what got my attention about Blend4Web was their attention to their product's potential for the retail world of online sales and interactive stores. Games are always fun and popular, and B4W's excellent system for making online games easily deserves commendations, however, for myself, retail is my type of game and here B4W shines.


Attached Image: smoker.jpg
Interactive Beehive Smoker


B4W has taken great care in producing an interface that allows all the important aspects of online retail such as proper Search Engine Optimization tags, meta-descriptions and titles, all within the B4W Blender interface. Files can be exported with single click, resulting in a fully-contained HTML file with a full 3d product, including hotlinks, reflections, glow effects, audio, and much more, all with no coding required. If one so chooses, models can be exported to individual JSON files for assembly later in a main scene, again all with hotlinks and glow in place.


Attached Image: thicket.jpg
A god rays and JSON test


To me, this is the future of the internet. Interactive user-friendly interfaces on a website that put the product virtually into the hands of consumers for perusal and more details. Blend4Web is an example of a company with forethought and vision. Retail may not be exciting to gamers, but to retailers, games are another product for the shelf, and Blend4Web makes putting those products on the shelf as easy as they have made making online games. With Blend4Web, everything in WebGL is simply a few clicks away.


Attached Image: b4w_001_21042015_210722.jpg


With constant updates, fast responses to questions on their forum, excellent detailed tutorials, and their ability to produce a quality product that easily makes fun and interesting web experiences for gamers and consumers, Blend4Web stands out in the new internet of The Good, The Bad and The WebGL-y.

Debugging - "Follow The Data"

$
0
0

Introduction


Everyone looks for quick answers. It's human nature. Here on gamedev, programmers all-too-often attempt to fix problems they encounter with their applications by posting several (or even 100s of) lines of code, and simply state: "Here's some code. It doesn't work. What's wrong?" The apparent hope of the OP ( Original Post[er] ) is that someone else will spot a typo, coding or logic error, and post information that will send the OP happily on his/her way. If the OP is very lucky, someone will spot the problem quickly and provide the hoped-for solution.

More often than not, however, the OP's expectations are unfounded, and the topic discussion will carry on for a day or more. More often than not, though the OP is willing to find and correct problems, the OP doesn't know how to begin to find the problem. Asking someone to find the problem for them seems like the only option.

The premise of this article is that there are techniques for debugging programs that will find the source of an error more quickly than posting the question "What's wrong?" and getting a response that resolves the problem. Further, learning to debug will have cumulative benefits. Not only will errors be found more quickly by the repeated practice of debugging, fewer problems will be encountered in future as the programmer finds and corrects errors, learning from his/her own mistakes.

Another assumption is that the programmer is willing to approach debugging with discipline - i.e., is willing to determine, rather than guess, what portion of the code is most likely the source of the problem.

Aye, there's the rub. How does one do that?

This article describes an approach to debugging that will often result in a programmer finding the problem in minutes, rather than days.

Other Debugging Techniques


Before a programmer dives into "Follow The Data" debugging, several alternative approaches may be useful, particularly in locating a good starting point for the investigation.

A common starting point used by many programmers to determine where a problem occurs is to comment out a few lines of code, in order to eliminate sections of code which may or may not be causing the problem. In the long view of things, that's just hacking, as "good programming practice" dictates that small sections of code are tested during project development, and should be known to be "correct." However, being realistic, quite often, that boat has sailed. Everyone cuts-and-pastes code, or codes several interdependent routines at once. Furthermore, problems may occur when "good" routines interact only intermittently, or only under specific conditions during execution.

As a result, commenting out sections of code, if the flow of the program allows it, may point to a section of code causing the problem. If so, knowing what section(s) of code needs further examination or debugging is a valuable clue. However, modifying code to determine where a problem occurs may itself result in further complications if results are misinterpreted, or the editing is not properly undone.

Less intrusive than modifying existing code, and a more obvious way to examine data values, just displaying values while the program is running will often provide sufficient information to determine the section of code in which an error occurs. If your application and/or API permit, values can be displayed by the program itself, or by dumping information to an accompanying console window.

The user must be familiar with text output techniques such as OutputDebugString (Visual Studio), std::cout, printf(...), etc. Particularly for graphics programs, an accompanying console window can be an invaluable debugging tool.


Attached Image: debug_valuedisplay.png


That approach will frequently enough result in the discovery, for instance: "I didn't consider negative numbers!" or similar oversights. However, that approach assumes the programmer already knows what values may be pertinent to the problem at hand.

In some cases, providing information on-screen can be quite useful. The programmer may want to use visual tools to aid in the debugging process. As mentioned in that article, such tools should be a complement to other debugging methods.

If additional information is needed to determine the problem, the programmer can prepare to "follow the data" by considering -

"Follow The Data" - An Approach to Debugging


This approach assumes that a program compiles and links without error, but, when executed, does not provide the "results" the programmer desires.

This approach can be used for determining, at a minimum, a section of code in which the problem is occurring, by following the data. With a little persistence, the problem can be found within a few lines of code, or even within a single line of code. The intent is to aid posters to anticipate the inevitable question: What have you tried?

The Concept


The concept of Following The Data is: The programmer examines actual runtime variable values to determine where "good" data turns to "bad" data. If a section of code has good values flowing into it, but the results flowing out of the section are not what is expected or desired, the process is refined to examine values in smaller and smaller sections of code, eventually locating, if not a single line of code, a reasonbly few lines of code that have correct values being used in calculations or function calls, but the results following execution of that code is not as expected.

The programmer can then check the syntax of the code, whether the appropriate function is being called, etc.; the programmer corrects the code; and the application is re-run to determine if the corrections just made solved the original problem.

Prerequisites for Following The Data


1. Know the Approach is Valid.

Computers are stupid. Feed good data to bad code and you'll get bad results. A program must be comprised of good code being fed good data.

In the context of this article, "good code" implies that the programmer takes responsibility to not only write code that implements an algorithm correctly, but takes responsibility to ensure that the algorithm itself is the appropriate method to achieve the desired results.

The benefit of understanding what code should do, and how that code should do it, will result in more quickly identifying sources of error. In addition, if a problem still cannot be located, the programmer will be better able to ask questions that will lead more quickly to the right answer. For example, a post asking "How do positions get converted to depth values?" will assuredly get better results than "My depth values are wrong. What's wrong with my code?"

As an aside, familiarity with the what and how of a process will make future changes, enhancements and refactoring of the code much easier.

2. Know what Good Data looks like.

The importance of being able to say: "I've verified the input to this section of code is what I expect." cannot be over-emphasized. It's not sufficient that data looks "about right." Computers do only what they're programmed to do, with the data fed into them. It's a case of GIGO: Garbage In, Garbage Out. For code to produce the desired results, the data must be more than "about right." It must be correct.

As implied in section The Concept above, the programmer must know what "good" data looks like. I.e., when a value is examined, the programmer must make a determination whether the problem has been found, or the debugging process needs to be continued. Sometimes it's sufficient to be able to recognize "bad" data or values, but knowing "good from bad" is better.

To distinguish good values from bad, the programmer should be familiar not only with what the code should do, but how the code should do it. That's commonly easier said than done, and may require research, self-education or formal education to gain that knowledge. That's the importance of Prerequisite No. 1 above.

3. Use an appropriate programming interface ( an IDE )

To follow the data, the programmer will need an IDE that supports setting breakpoints, and examining or displaying individual variable values while the suspect program is running. If a programmer does not have those capabilities at hand, the "follow-the-data" approach is all but impossible.

If you aren't using an interface that provides those means: get one.

The following illustrates the benefits of an IDE as described above. As an example, a program returns an error (or "crashes") when trying to open a file. The progam code makes a call to determine the path to be used; the name of the file to be opened is appended to the path; and a function is called to open the file given a string comprised of the path + filename. The programmer knows that the correct path to the file must be provided to the function which opens the file. One of the first things that must be checked then: is the path correct? The programmer sets a breakpoint at the code which determines the path to be used, and examines the path.


Attached Image: debug_mouseover.png


The programmer mouses over the variable loc to determine if it is what was assumed when the code was written. If the programmer understands how the code should work, and what "good" input data looks like, he/she may immediately recognize: "The path doesn't end with slashes!" That is, merely appending the filename to the variable loc would result in "C:\\VisualStudio\\vehiclemyFile.txt", rather than "C:\\VisualStudio\\vehicle\\myFile.txt" The problem has been located and can be corrected. Time expended: a few minutes.

Just for the purposes of illustration of the benefit of a good debugging IDE, more detailed data can be examined by (in this example) clicking on the triangular "drop-down" symbol by the variable name in the value popup. Shown below, the contents of the array buf can be examined, character-by-character.


Attached Image: debug_dropdown.png


Follow The Data


Even with the knowledge of what the code should do, how the code should do it, and the tools to determine if the code, in fact, does what it should, it's not always easy to determine where to start. Unfortunately, there are more types of problem indications than can be addressed in a generic way.

As mentioned above, if the programmer can determine a section of code which causes the problem, perhaps by commenting out lines or sections of code, that can provide a starting point.

Lacking that information, the programmer can start at the beginning - start at the program's entry point.

Step 1: Set a breakpoint and examine values.

Start by setting a breakpoint at a point in the code where values can be examined and determined to be good or bad. That breakpoint may have to be in, for example, in the program's main() procedure. As experience in programming and debugging is gained, choosing an appropriate location for a breakpoint closer to the source of the problem will get easier.

Examining values should be approached with rigor. That is, each value that has any possibility of affecting the results must be looked at.

Certainly, examining the most obvious* values within a section of code can be done first. However, if no incorrect values are found among those examined, either examine them all, or make a note that there still may be a problem in that section of code.

* What is an "obvious" value comes with the understanding of what the code is supposed to do, and how it should do it.

If the values at that point in the program are correct, continue with this same step. I.e., set a breakpoint further along in the code.

Step 2: One or more incorrect values have been found. Determine why the value(s) are incorrect.

That may be easier said than done. However, as mentioned above, the programmer now has to look at both what the code is supposed to do, and how the code does it. Being realistic, some "what's" and "how's" may not be well understood by the programmer. This may be an occasion to post a question here on gamedev.

That post can now be of the form: "I want the following 4 lines of code to [description of do WHAT]. I have verified that the input values up to this point are correct, but the value of [a variable that's been examined] is incorrect. Can someone help me determine whether the code is correct for what it's supposed to do? Is there a better way to do that?" That will likely get better responses than "Here's 20 lines of code. It doesn't seem to work right. What's wrong?"

It is often the case that it is faster, and likely a better learning opportunity, to review (for example) the documentation for each function call, to determine if what the code should do, and how it does it, are appropriate.

Example of Following the Data


Shader Input Problem - A Subtle Error

The display of a skinned mesh didn't "look right." A decision was made to determine if the shader itself, or the data being fed to the shader, was at fault. Using a shader debugger, it was determined by examining input values to the vertex portion of the shader, that the values were incorrect. That didn't mean the shader was correctly coded, but, at a minimum, one or more problems existed before the shader was called.

Considering the possibility that the data may not be correct from the very start, a breakpoint was set in the routine that loaded the vertex data from a file and created the vertex buffer from that input data. The data used to fill the vertex buffer was examined and, to the best of the programmer's knowledge, appeared to be correct. The vertex buffer was created without error. It also appeared that the indices and index buffer was created correctly.

As the next use of that data was rendering it, a breakpoint was set at the beginning of the routine for rendering skinned meshes. The code leading up to the draw call which used that shader was comprised of a dozen or more steps, such as binding the vertex and index buffers, setting the stride and offset for the vertex buffer, binding constant buffers and textures, etc. "Obvious" variables were examined first. E.g., the pointers to the vertex and index buffers were not NULL, nor were the pointers to the buffers and textures.

A more rigorous check of the value of each variable in each call in that section of code was made. It was determined that the stride for the vertex buffer was based on a vertex structure for a static mesh (unskinned), rather than the vertex structure for a skinned mesh. That is, the static mesh vertex did not include blend indices or blend weights, though the rest of structure was identical to the structure for the skinned mesh.

The error was caused by using sizeof(StaticMeshVertex) for the stride, rather than sizeof(SkinnedMeshVertex). The error was made even more subtle because the vertex stride was stored in the mesh structure itself, and was accessed with mesh->stride.

Conclusion


Learning how to debug efficiently will save the programmer time. "Following the Data" is one technique that, if practiced and applied conscienciously, will do just that.

Article Update Log


15 Feb 2015 - Draft completed.
16 Feb 2015 - Approved for peer review.

Weiler-Atherton in 3D

$
0
0
The well-known Weiler-Atherton Algorithm of the polygons clipping usualy is demonstrated in 2D performance. Nevertheless this idea also works in 3D.

The demo programs concerned Weiler2D.exe and Weiler3D.exe are in the Weiler3D directory to be unpacked from the attached article resource archive.

1.Weiler-Atherton in 2D


The Weiler-Atherton Algorithm of the two 2D polygons may be performmed as 3 steps:

  1. To create the set of segments consisted of the vertexes of the 1st polygon contained inside the 2nd polygon the points of the ribs inertsection included.
  2. To create the set of segments consisted of the vertexes of the 2nd polygon contained inside the 1st polygon the points of the ribs inertsection included.
  3. To merge the sets of segments above with the inersection points.

The following illustrations have been created with the Demo Program Wailer2D.exe:

In fig 1.1 two randomly created polygons Red and Blue to be clipped.

Attached Image: fig_1_1.JPG

In fig 1.2 the set of Magenta segments of the the vertexes of the Red polygon are contained inside the Blue polygon and the set of Aqua segments of the the vertexes of the Blue polygon are contained inside the Red polygon.

Attached Image: fig_1_2.JPG

In fig 1.3 The sets of Magenta and Aqua segments are moved aside for the demonstration purposes.

Attached Image: fig_1_3.JPG

In fig 1.4 The sets of Magenta and Aqua segments are moved together to create clipping polygons.

Attached Image: fig_1_4.JPG

In fig 1.5 the the Yellow clipped polygons are shown together with the original Red and Blue polygons.

Attached Image: fig_1_5.JPG

You may create your own performance of the 2D Weiler-Atherton Algorithm with the program Wailer2D.exe.

To watch step by step performance use the Right Arrow button while the Play timer is stopped.

To start clipping press Enter button.

All the commands for Weiler2D.exe available are shown in the Help Dialog (press F1 button to show)

Attached Image: FIG_1_6.jpg

To start the new scenario just press Space Bar. The polygons are randomly created and randomly oriented and randomly rotated.

2.Weiler-Atherton in 3D


The Weiler-Atherton Algorithm of the two polyhedrons clipping may be performmed as 3 steps:

  1. To create the set of polygons consisted of the vertexes of the 1st polyhedron contained inside the 2nd polyhedron the points of the polygons inertsection included.
  2. To create the set of polygons c consisted of the vertexes of the 2nd polyhedron contained inside the 1st polyhedron the points of the polygons inertsection included.
  3. To merge the sets of polygons above with the inersection points.

The next illustrations has been arranged with the Demo Program Wailer3D.exe:

In fig 2.1 two randomly created Red and Blue polyhedrons randomly oriented to be clipped.

Attached Image: fig_01.JPG

In fig 2.2 the Red and Blue polyhedrons moved into random position to start clipping.

Attached Image: fig_02.jpg

In fig 2.3 the Red and Blue polyhedrons in random position are shown in blending mode as semi-transparent.

Attached Image: fig_03.jpg

In fig 2.4 the sets of the Red polyhedron faces inside the Blue one and the sets of the Blue polyhedron faces inside the Red one the segments of intresection included are moved aside for the demonstration purposes.

Attached Image: fig_04.jpg

In fig 2.5 the sets of the Red polyhedron faces inside the Blue one and the sets of the Blue polyhedron faces inside the Red one the segments of intresection included are moved together to obtain the clipped polyhedron.

Attached Image: fig_05.jpg

You may select Play menu to watch the clipped polyhedron faces and/or you may use Mouse move with the left mouse button pressed.

To watch step by step performance use the Right Arrow button while the Play timer is stopped.

All the commands for Weiler3D.exe available are shown in the Help Dialog (press F1 button to show)

Attached Image: FIG_06.png

To start the new scenario just press Space Bar. The polyhedrons are randomly created and randomly oriented and randomly rotated.

The programs above have been developed on the MFC platform. Needless to say that it is not a problem to develop them in Win32 or any other platform. The pseudocode of the procedures used in Weiler3D are provided below:

declare:
Plane  :    space area determined with the normal vector and the distance of axis centre
Polygon:    list of the vertices layed in one plane
Polyhedron: list of the polygons conected
//////////////////////////////////////////////////////////////////
Procedure main
begin
Polyhedron Red
Polyhedron Blue
Polyhedron Mixed
ClipPolyHedrons( Red, Blue, &Mixed)
end
//////////////////////////////////////////////////////////////////
Procedure ClipPolyhedrons( Polyhedron p0, Polyhedron p1, Polyhedron * pRslt)
begin
ClipPolyhedronIn(Polyhedron p0, Polyhedron p1, Polyhedron * pRslt)
ClipPolyhedronIn(Polyhedron p1, Polyhedron p0, Polyhedron * pRslt)
end Proc
///////////////////////////////////////////////////////////////////
Procedure ClipPolyhedronIn( Polyhedron p0, Polyhedron p1, Polyhedron * pRslt)
//pRslt is a list of polygons of  Polyhedron p1 contained inside 
//the Polyhedron p0 intersected polygons including
begin
with Polyhedron p0 
   for every polygon
      Polygon pCur = the current polygon;
      Polygon pNew = the result of the intersection of the Polygon pCur and Polyhedron p1
	  IntersectPolygon(p1, pCur, &pNew)
	  if there are any vertices in the Polygon pNew
	      Polygon pNew is appended to the polygon list in Polyhedron * pRslt
      end if 
    end for
end Proc
/////////////////////////////////////////////////////////////////////////////
Procedure IntersectPolygon(Polyhedron  phdr, Polygon plgn, Polygon * pRslt)
//pRslt is a list of vertises of  Polygon plgn contained inside 
//the Polyhedron phdr vertises of the intersection including
begin
if Polygon plgn is completely inside of the Polyhedron  phdr  
   make Polygon * pPslt as copy of  Polygon plgn;
   return;
end if

Plane pA    //The Plane of the Polygon plgn vertices
Polygon pT  //The Polygon obtained with the intersection of the Polyhedron  phdr by the Plane pA

IntersectPlane(phdr, pA, pT);
if Polygon pT has no vertices
   return;
end if

ClipPolygons(plgn, pT, pRslt);
end Proc
//////////////////////////////////////////////////////////////////////////
Procedure IntersectPlane(Polyhedron  phdr, Plane pA, Polygon * pRslt)
//pRslt is a list of vertises of  the intersection Polyhedron  phdr by the Plane pA 
begin
with Polyhedron phdr 
   for every polygon
      Polygon pCur = the current polygon;
	  if all the vertices of the Polygon pCur layed in the Plane pA
        make Polygon * pPslt as copy of  Polygon pCur;
        return;
      end if
	  let plt - the list of vertices of the intersection of the Polygon pCur with the Plane pA 
	  IntersectByFlat(pCur, pA, &plt);
	  with the list of vertices plt
   	     for all the vertices 
		    if current vertice is not in the list of the  Polygon * pRslt
			    append current vertice to the list of the  Polygon * pRslt
            end if
         end for
   end for
end Proc
//////////////////////////////////////////////////////////////////////////
Procedure IntersectByFlat(Polygon plgn, Plane pA, list of intersection vertices &plt)
begin
with Polygon plgn
   for all the vertexes
    let pV = the current vertex;
    let pVn = the next vertex in the list Polygon plgn
	double d0 = Distance of pV to Plane pA;
	double d1 = Distance of pVn to Plane pA;;
	if(d0 > 0 && d1 >= 0 || d0 < 0 && d1<=0)
	  continue;
    end if 
    Intersection vertex pU:
    Vector * pU =  new Vector(* pV -(* pVn - * pV)*d0/(d1 - d0));
	  Append vertex pU to the list of vertices plt 
   end for
end Proc
///////////////////////////////////////////////////////////////////////////////////

The pseudocode of the ClipPolygons procedure has been ommited because it is a standard Weiler-Atherton algorithm in 2D. A lot of links concerning this algorithm can be found just by typing "Weiler-Atherton" in a search box (e.g. Weiler-Atherton Algorithm (Attached File  visibility.pdf   12.72MB   9 downloads
))

Conclusion


The Demo above shows that the Weiler-Atherton Algorithm of clipping is working in 3D as well. The Weiler3D.exe has been created on the basis of NeHe's OpenGL Lessons mentioned in my former article. It seemed worth to use the Weiler-Atherton Algorithm of clipping in 3D simple applications and I believe it will work in 4D and 5D as required.

Writing Efficient Endian-Independent Code in C++

$
0
0
Once upon a time, there was an article published on gamedev.net [Roy2013], which described a way (as he says, mostly taken from Quake2 engine) to deal with Little-Endian/Big-Endian issues in games. While this approach is mostly sound (“mostly” because of unaligned-read issues which will be discussed below), it is not the most efficient one. Better (simpler, faster, and more general) approaches do exist, and they will be discussed below.

What is Endianness


Endianness itself has been described in many different works, including [[Roy2013] and [WikipediaEndianness]. Basically, it is a way that CPU stores multi-byte data in memory; little-endian systems store least significant byte first, and big-endian ones store most-significant byte first. So, if you have

uint16_t x = 1234; 

then x will look as {0xD2, 0x04} on a little-endian system, and as {0x04, 0xD2} on a big-endian system. As a result, code such as

send(socket,&x,2);

will send different data over the wire depending on system endianness (little-endian systems will send {0xD2,0x04}, and big-endian ones will send {0x04,0xD2}).

It is important to note that endianness effects cannot be observed unless we have some kind of cast between pointers on data of different sizes (in the example above, there was an implicit cast from &x, which is uint16_t*, to void*, which is actually treated as byte pointer by the send() function). In other words, as long as we keep away from casts and stay within arithmetical and bitwise operations without pointer casts, the result is always the same regardless of endianness. 2+3 is always 5, and (((uint16_t)0xAA)<<3)^0xCCCC is always 0xC99C, regardless of the system where our code is running. Let's name such calculations endianness-agnostic.

Scope


First of all, where do we need to deal with little-endian/big-endian issues? In fact, there are only two scenarios of which I know, where it is important. First one is reading files (which might have been written on a different machine), and another one is network communication. From our perspective, both of these cases are essentially the same: we're transferring data from one machine to another one.

Serialization/Marshalling


One thing which should be noted for both these data-transfer-between-machines scenarios, is that you should never transfer data as a C structure; instead, you should serialize/marshal it. Putting C structure in a file (which may be read on another machine) or over the network, is a Really Bad Idea for several reasons.

First of all, when writing/reading C structure to external storage, you're becoming a hostage of implicit alignment rules of the compiler you're using. In general, when you have a structure such as

struct X {
uint8_t a;
uint32_t b;
};

then sizeof(X) won't be 5 bytes as some might expect; in many cases sizeof(X) will be 8 bytes (1 byte of a, then 3 unused bytes of padding just to make b aligned on a 4-byte boundary, and then 4 bytes of b), but this is not guaranteed at all. To make things worse, the amount of alignment is not specified by standards, so when you're switching from one compiler to another one, it may change (not to mention switching between CPUs); to make things even worse, it can be affected by compiler switches and on a struct-by-struct basis by things such as #pragma pack.

If you are using types such as int or long (rather than guaranteed-size-types such as uint8_t and uint32_t), things worsen even further (yes, this is possible) – due to different sizes of these types on different platforms. Oh, and don't forget that variable-length strings and C++ containers are clearly off-limits.

There are other (rather minor) reasons for avoiding writing C structures directly: you'll write more data then necessary, the data written will include garbage (which will affect the ability to compress it), and so on. However, the most important issue is (lack of) inter-platform and inter-compiler compatibility mentioned above.

These issues are so important, that in the networking world sending C structures over the network is universally considered a Big No-No.

So, what you should do when you need to send a C structure over the network (or to save it to the file)? You should serialize it first (in network world term “marshal” is generally preferred, though it is essentially the same thing).

Implementing Serialization


The idea behind serialization is simple: for the struct X above you write one byte of a, and 4 bytes of b, avoiding alignment issues. In fact, you can go further and use, for example, VLQ [WikipediaVLQ] variable-length encoding, or put null-terminated strings into your serialized data.

One way of serializing data (the one I prefer), is to have serialize/deserialize functions such as

void serialize_uint16(DataBlock&, uint16_t);//DataBlock should grow as the data is serialized
uint16_t deserialize_uint16(Parser&);//there is constructor Parser(DataBlock&)

When we have these functions implemented, then serializing our struct X will look as

DataBlock data;
serialize_uint8(data,x.a);
serialize_uint32(data,x.b);

(and deserializing will look similar).

So far so good, now let's see how we can implement our serialize_uint16() function. If we will implement it according to [Roy2013], it would look like:

void serialize_uint16(DataBlock& data,uint16_t u16) {
  void* ptr = data.grow(2);//add 2 bytes to the end of data, and return pointer to these 2 bytes
  u16 =  LittleShort(u16);//calling ShortSwap on big-endian systems, and ShortNoSwap on little-endian systems
  *(uint16_t*)ptr = u16; //(*)
}

This would work fine on x86 and x86-64, but on the other platforms the line marked as (*) may run into problems. The problem is that our ptr might be either even or odd; and if it is odd – some CPUs will refuse to read 2-byte data from it (also they will usually refuse to read 4-byte data unless its address is a multiple of 4, and so on). This never happens on x86/x86-64, but happens on SPARC, and may or may not happen on ARM (unless we specify __packed qualifier for uint16_t*, but it is not universally available).

Another Popular Alternative


Another popular alternative (thanks to Servant of the Lord for reminding me of it) is based on LITTLE_ENDIAN and BIG_ENDIAN macros. In some sense, it can be seen as the same serialize_uint16() as above, but using different implementation for BigShort() etc.:

//code courtesy of Servant of the Lord
#ifdef LITTLE_ENDIAN
    #define BigShort(x)     ShortSwap(x)
    #define LittleShort(x)  (x) //Do nothing, just 'return' the same variable.
    #define BigLong(x)      LongSwap(x)
    #define LittleLong(x)   (x)
    #define BigFloat(x)     FloatSwap(x)
    #define LittleFloat(x)  (x)
#elif defined(BIG_ENDIAN)
    #define BigShort(x)     (x)
    #define LittleShort(x)  ShortSwap(x)
    #define BigLong(x)      (x)
    #define LittleLong(x)   LongSwap(x)
    #define BigFloat(x)     FloatSwap(x)
    #define LittleFloat(x)  (x)
#else
    #error No idea about endianness
#endif

While it is faster and less bulky than a previous one (see "Performance Analysis" section below), it has the same problem with unaligned read/writes on non-x86 platforms :-(. In other words, for serialization purposes it won't work, for example, on SPARC (and it working for ARM is not guaranteed).

What Is to be Done?


What is to be done?
-- name of the novel by Nikolay Chernyshevsky, 1863 --


The answer is quite simple, actually. Instead of writing two bytes as one chunk, we can always write it byte-by-byte:

void serialize_uint16(DataBlock& data,uint16_t u16) {
  uint8_t* ptr = data.grow(2);
  *ptr++ = (uint8_t)u16;
  *ptr = (uint8_t)(u16 >> 8);
}//deserializing is very similar

This technique is well-known (see, for example, [Pike2012], but the idea is known for years before); a Really Good Thing about it is that we don't need to care about endianness at all(!). This stands because the code above doesn't perform any casts, and calculates all the bytes in a completely endianness-agnostic manner (see “What is Endianness” section above); and all writes are exactly 1 byte in size, so there is no chance for endianness to manifest itself.

While [Pike2012] argues that all the other marshalling methods represent a fallacy, I'm not so sure about it, and will describe an improvement over byte-by-byte marshalling in a moment.

Further Optimization


When I really care about performance (which I usually do, as server-side handling of billions of network messages per day is quite a significant load), I often add a special handling for those platforms of the most interest, for example (taken from [NoBugs2015]):

void serialize_uint16(DataBlock& data, uint16_t u16) { //assuming little-endian order on the wire 
  uint8_t* ptr = data.grow(2);
#if defined(__i386) || defined(__x86_64__) || defined(_M_IX86) || defined(_M_X64) 
  *(uint16_t*)ptr = u16; // safe and fast as x86/x64 are ok with unaligned writes
#else 
  *ptr++ = (uint8_t)u16;
  *ptr = (uint8_t)(u16 >> 8);
#endif 
} 

With this approach, we have the best of both worlds: (a) universal version (the one under #else) which works everywhere, and (b) optimized version for specific platforms which we know for sure will work efficiently there.

Performance analysis


Now, let's analyze relative performance of all three approaches: (a) the one from [Roy2013], (b) LITTLE_ENDIAN/BIG_ENDIAN based, © endianness-agnostic one (see [Pike2012]), and (d) the one from [NoBugs2015]. For the purposes of our analysis let's assume that all the data is already in L1 cache (it is the most common case for continuous reading, if it isn't, penalties will be the same for all the methods). Also, let's assume that L1 reads cost 2-3 clocks (L1 latencies with modern x86 CPUs are around 4-5 clocks, but latency isn't exactly translated to overall execution time, so 2-3 clocks works as a reasonable estimate); writes are usually around 1 clock. Also, we won't count costs of data.grow() for writing and of parser offset management for reading; it can be done in a manner that ensures amortized costs are quite low (of the order of single-digit clocks), and it will be the same regardless of the endianness handling method.

LITTLE_ENDIAN/BIG_ENDIAN-based marshalling is certainly not bad performance-wise: it can be inlined easily, and has a cost of 1 clock for writing and 2-3 clocks for reading.

[Roy2013] causes a function-call-by-pointer on each conversion; most importantly, such calls cannot possibly be inlined. From my experience, on x86 function calls with such parameters usually cost around 15-20 CPU clocks (while CALL/RET instructions are cheap, all the required PUSH/POPs and creating/destroying stack frame, taken together, are not), compared to inlined version. In addition, it will need roughly 1 clock to write the data (and 2-3 clocks to read), making the total for writing around 16-21 clocks and total for reading around 17-23 clocks.

Endianness-agnostic approach can be inlined easily; however, it causes 2 writes/reads instead of 1 (and compilers don't combine them, at least I've never seen a compiler combine 2 writes/reads), which is normally translated into 2 clocks for writing and 4-6 clocks for reading; also, it requires shifts and casts, which also cost around 2 additional clocks, making totals for writing around 4 clocks and total for reading around 6-8 clocks.

[NoBugs2015] is optimized for x86, and can be inlined too; same as LITTLE_/BIG_ENDIAN one, it has cost of 1 clock for writing and 2-3 clocks for reading.

Of course, the analysis above is very approximate and there are other things not taken into account (such as larger size of inline functions, which in general may affect caches), but I feel that these other considerations in most cases won't affect the overall picture.

Implementation Notes


One thing to note when implementing marshaling, is that in most cases it is simpler to do it using unsigned integers rather than signed ones; while using signed types isn't formally a bad thing, in practice it tends to cause trouble. Not that it isn't possible to implement marshalling with signed ints - it is just simpler to implement it with unsigned ints, with one less thing to worry about. For a list of troubles which can be caused by using signed stuff for marshalling - see a comment by SICrane below; however, you don't really need to care about them - just use unsigned and you'll be fine :-).

Another thing to keep in mind is to use those guaranteed-size types such as uint32_t and uint16_t (rather than int and short). You never know where your code will be compiled in 5 years from now, and just recently I've seen a guy who needed to fix his code because when compiling for AVR8, sizeof(int) is 2 (but sizeof(uint32_t) is always 4, regardless of the platform).

Summary


Properties of the three ways to handle endianness can be summarized in the following table:


Applicability Clocks on x86, write uint16_t Clocks on x86, read uint16_t Clocks on x86, write uint32_t Clocks on x86, write uint32_t Clocks on x86, read uint32_t
[Roy2013] Only C-structure based 16-21 17-23 16-21 17-23
LITTLE_/BIG_ENDIAN Only C-structure based 1 2-3 1 2-3
Endianness-agnostic Both C-structure based and serialization 4 6-8 8 12-16
[NoBugs2015] Both C-structure based and serialization 1 2-3 1 2-3


Of course, on non-x86 platforms the picture won't be as good for [Nobugs2015] as it is written, but it will still perform exactly as the endianness-agnostic one, and there will be an option to optimize it for a specific platform (in the manner similar to x86 optimization) if necessary and possible.

References


[Roy2013] Promit Roy, Writing Endian Independent Code in C++, 2013, http://www.gamedev.net/page/resources/_/technical/general-programming/writing-endian-independent-code-in-c-r3301
[WikipediaEndianness] https://en.wikipedia.org/wiki/Endianness
[WikipediaVLQ] https://en.wikipedia.org/wiki/Variable-length_quantity
[Pike2012] Rob Pike, The Byte Order Fallacy, 2012, http://commandcenter.blogspot.com/2012/04/byte-order-fallacy.html
[NoBugs2015] 'No Bugs' Hare, 64 Network DO's and DON'Ts for Game Engine Developers, Part IIa, Protocols and APIs, 2015 http://ithare.com/64-network-dos-and-donts-for-game-engine-developers-part-iia-protocols-and-apis/

Article Update Log


Jun 5, 2015: Minor change to explanation "why signed is bad" in Implementation Detail section
Jun 4, 2015: Added LITTLE_/BIG_ENDIAN approach to those being analyzed
Jun 4, 2015: Added 'Implementation Notes' section
Jun 2, 2015: Initial release

Generalized Platformer AI Pathfinding

$
0
0

Preamble


If you're writing a "jump and run" style platformer game, you're probably thinking about adding some AI. This might constitute bad guys, good guys, something the player has to chase after etc... All too often, a programmer will forego intelligent AI for ease of implementation, and wind up with AI that just gives up when faced with a tricky jump, a nimble player, or some moving scenery.

This article presents a technique to direct AI to any arbitrary static location on a map. The path an AI takes may utilize many well-timed jumps or moving scenery pieces, as long as it starts and ends in a stationary location (but this doesn't always have to be true).

We'll cover the basic idea and get an implementation up and running. We'll cover advanced cases including moving platforms/destructible walls in a future article.

This Technique is used in the game Nomera, at www.dotstarmoney.com or @DotStarMoney on Twitter.


e3iKSJ7.png


Before going any further, make sure you cannot implement a simpler algorithm due to constrained level geometry. I.e: all collision for levels is done on a grid of squares (most 2D games). In these cases you can get solid AI pathing with simpler techniques, this method is primarily for those who want their game AI to be human-like.

Getting Ready


Before we begin, it's good to have a working knowledge of mathematical graphs and graph traversal algorithms. You'll also need to be comfortable with vector maths for pre-processing and finding distances along surfaces.

This technique applies to levels that are composed primarily of static level pieces with some moving scenery, and not levels that are constantly morphing on the fly. It's important to have access to the static level collision data as line segments; this simplifies things though this technique could easily be extended to support any geometric objects you use for collision.

The Big Idea


In layman's terms: As a developer, you jump around in the level between platforms, and the engine records the inputs you use from the point you jump/fall off of a platform, until the time you stand on the next one. It counts this as an "edge," saving the recorded inputs. When an AI wants to path through the level, he treats the series of platforms (we'll call them nodes from here on out) as vertices, and the recorded edges between them as a graph. The AI then takes a path by alternating walking along nodes, and taking the recorded input along edges to reach a destination. There are many important distinctions we'll need to make, but for now, just focus on the broad concepts.

The technique we'll use is a combination of two algorithms. These are, creating the pathing graph, or "creating the data structure AI will utilize to path through the level" and traversing the pathing graph, or "guiding the enemy through the level given a destination". Obviously the latter requires the former. Creating the pathing graph is summarized as follows as follows:

  1. Load the level static collision data and compute from it a series of nodes.
  2. Load any recorded edges (paths) for the level and add these to their respective start nodes.
  3. Using the enemy collision model and movement parameters, record paths between nodes and add these to the graph.
  4. When exiting the level, export the recorded edges for the level.

This might not totally make sense right now, but we'll break it down step by step. For now it's good to get the gist of the steps.

Now a summary of traversing the pathing graph:

  1. Recieve a destination in the form of a destination node, and distance along that node; Calculate similar parameters for the source (starting) node.
  2. Compute a path, using any graph traversal algorithm from source to destination where the path is a series of nodes and edges.
  3. Guide the AI across a node to an edge by walking (or running, whatever the AI knows how to do) to reach the correct starting speed of the next edge in the path.
  4. Once the AI has reached the start location of the next edge in the path to some tolerance in both position and velocity, relinquish automatic control of the AI and begin control through the edges frame by frame recorded input.
  5. When recorded input ends, give control back to the automatic movement for whichever node upon which the AI stands.
  6. Repeat the last three steps until the destination has been reached

Kinda getting the feel of it? Lets break down each step in detail.

Implementing Pathfinding Step by Step


Creating the Pathing Graph


The pathing graph is made up of platforms/nodes, and connecting nodes to nodes are recordings/edges. It is important to first write hard definitions for what constitutes a platform, and what constitutes a recording.

A node/platform has the following properties:
  • It is a subset of the line segments forming the level geometry.
  • Assuming normal gravity, all segments in the node are oriented such that their first vertex has a strictly smaller x coordinate than their second. (this would be reversed for inverted gravity)
  • Each subsequent segment in the node starts where the last segment ended.
  • Each segment in the node is traversable by an AI walking along its surface
What does this add up to? The following key idea: A node can be traversed in its entirety by an AI walking along its surface without jumping or falling and an AI can walk to any point along the node from any other point.

Here is a picture of a level's collision geometry:


gMek452.png


And here it is after we have extracted all of the nodes from it (numbered and seperately colored for clarity). In my implementation, node extraction is performed when the level is loaded, this way when a level is built you don't have to go back and mark any surfaces. You'll notice it's basically an extraction of "all the surfaces we could walk on:"


MGnhyFZ.png
NOTE: this image has a small error: 26 and 1 are two different nodes, but as you can see, they should be the same one.


Depending on how your level geometry is stored, this step can take a little extra massaging to transform the arbitrary line segments into connected nodes.

Another important aside, if you have static geometry that would impede the travel along a node (like a wall that doesn't quite touch down to the ground), you'll need to split nodes along this barrier. I don't have any in my example, but this will cause major complications down the road if you don't check for it.

Once you have the nodes, you've completed the first step in creating the pathing graph. We also need to establish how we quantify position. A position, as used in determining sources and destinations for pathfinding, is a node (by number in this case), and a horizontal displacement along that node from its leftmost point. Why a horizontal displacement instead of an arc length along the node? Well let's say an AI collision body is a square or circle walking along a flat surface approaching an upward slope. Could its surface ever touch the interior corner point of the slope? Nope, so instead, position is measured as a horizontal displacement so we can view nodes as a "bent, horizontal line".

To complete the second and third step, we need to clarify what an edge/recording is.

An edge has the following properties:
  • An edge has a start position, and destination position on two different nodes (though it could be the same node if you want to create on-platform jump shortcuts!)
  • An edge has a series of recorded frame inputs that, provided to an AI in the edge starting position and starting velocity, will guide the AI to the position specified by the destination position
A couple of things here: it is extremely neccessary that whatever generated the recorded frame input series had the EXACT collision and movement properties as the AI whose edge pathing was being created. The big question here, is where do the recorded frame inputs come from... you!

Heres the jump:

In Nomera's game engine in developer mode, recording can be turned on such that that as soon as the player takes a jump from a node, or falls off of a node, a new edge is created with starting position equal to the position that was fallen off of/jumped from. At this point, the player's inputs are recorded every frame. When the player lands on a node from the freefall/jump, and is there for a few frames, the recording is ended and added as an edge between the starting node and the current node (with positions of course).

In other words, you're creating snippets of recorded player inputs that, if an AI is lined up with the starting position, the AI can relinquish control to these inputs to reach the destination position.

Also important, when recording, the player's collision and movement properties should be momentarily switched to the AI's, and the edge marked as "only able to be taken" by the AI whose properties it was recorded with.

The second step in creating the pathing graph is just loading any edges you had previously made, where the third is the actual recording process. How you do the recording is entirely up to you. Here is a screenshot of Nomera with the edges drawn on the screen. The lines only connect the starting and ending positions and don't trace the path, but it gets across the technique:


9JQtXym.png?1


In the upper left you can see marks from the in-game edge editor. This allows deletion of any edges you aren't particularly proud of, or don't want the AI to try and take. It also displays the number of frames the input was recorded for.

Of course, an edge needs more properties than just the recorded frames, and starting and ending positions. As has been previously mentioned, the velocity at the start of the edge is critical as will become more obvious later. It is also beneficial to have easy access to the number of frames the edge takes, as this is useful in finding the shortest path to a destination.

At this point, you should have the knowledge to build a pathing graph of platform nodes, and the recorded edges connecting them. What's more interesting though, is how AI navigates using this graph.

Traversing the Pathing Graph


Before we dive into how we use the pathing graph, a word on implementation.

Since we're essentially recording AI actions across paths, it's a good idea to have your AIs controlled with a similar interface as the player. Let's say you have a player class that looks something like this:

class Player{
    public:
    
    // ...
    
    void setInputs(int left, int right, int jump);
    
    // ...
    
    private:
    
    // ...
}

Where "left, right, and jump" are from the keyboard. First of all, these would be the values you record per frame during edge recording. Second of all, since the AI will also need a "setInputs" control interface, why not write a REAL interface? Then it becomes reasonably more modular:

enum PC_ControlMode{
    MANUAL,
    RECORDED
}

class PlatformController{
    public:
    
    // ...
    
    void setManualInput(int left, int right, int jump);        	
    void bindRecordedInput(RecordedFrames newRecord);
    
    int getLeft();
    int getRight();
    int getJump();
    
    void step(timestep as double);
    
    // ...
    
    protected:
    
    PC_ControlMode controlMode;
    RecordedFrames curRecord;
    
    void setInputs(int left, int right, int jump);
    
    // ...
    
}

class Player : public PlatformController{
        
    // ...   
    
}

class AI : public PlatformController{
     
    // ...
    
}


Now, both AI and player classes are controlled using an interface that's extendable to switch either between manual control or recorded. This setup is also convenient for pre-recorded cut scenes where the player loses control.

Okay, so we want black box style methods in our AI controller like:

	createPath(positionType destination);
	step(double timestep);

Where the former sets up a path between the current position and the destination position, and the latter feeds inputs to setInputs() to take the AI to the destination. In our step by step outline, createPath forms the first two steps and step, the last three. So let's look at creating the path.

A path will consist of an ordered sequence, starting with an edge, of alternating nodes and edges, ending in the final edge taking us to the destination node.

We first need to be able to identify our current position, be it in the air or when resting on a node. When we're on a node, we'll need a reference to that node and horizontal position along it (our generic position remember?)

To build the path, we use a graph traversal algorithm. In my implementation, I used Djikstra's algorithm. For each node we store, we'll also store with it the position we'd wind up in given the edge we took to get there (we'll call this edgeStartNodeCurrentPositionX for posterity's sake). Therefore, edge weights are computed for a given edge like so:

	edgeFrameLength = number of frames in the edge recording
	walkToEdgeDist  = abs(edgeStartX - edgeStartNodeCurrentPositionX)
        
	edgeWeight = edgeFrameLength * TIMESTEP + walkToEdgeDist / (HORIZONTAL_WALKING_SPEED)
        
	if(edgeDestinationNode == destinationPositionNode){
		edgeWeight += abs(edgeEndX - destinationPositionX) / (HORIZONTAL_WALKING_SPEED)
	}

As you can see, our final edge weight is in terms of seconds and is the combination of the time taken in the recording, and the time taken to walk to the start of the edge. This calculation isn't exact, and would be different if sprinting was part of enemy movement. We also check to see if we end on the destination node, and if so, the walking time from the edge end position to the destination position is added to the weight.

If we can calculate our edge weights, we can run Djikstra's! (or any other graph traversal algorithm, A* is fine here if you use a "euclidian distance to the destination" type heuristic).

At this point, you should have a path! We're almost there, and to cover the 4 steps of the outline, there's not a lot to do. Basically, we have two procedures that we switch between depending on whether or not we stand on a node, or are being controlled by an edge recording.

If we're on a node, we walk from our current position in the direction of the edge we have to take next. Now I mentioned previously that we also need to know the starting velocity of recorded edges. This is because, more often than not, your AI might have a little acceleration or decceleration when starting or stopping from walking. One of these transitional speeds may have been the point when the target edge began. Because of this, when we're walking towards the edge start location, we might have to slow down or back up a bit to take a running/walking start.

Once we reach the start position of the edge we're going to take, more than likely, our position will not match the edge start position exactly. In my implementation the position was off rarely more than half of a pixel. What's important is that we reach the edge start position within some tolerance, and once we do, we'll snap the position/velocity of the AI to those of the edge start position/velocity.

Now we're ready to relinquish control to the edge recording.

If we're on an edge, well, each frame just adopts the controls provided by the edge recording and increase the number of the recorded frame that we read. Thats it! Eventually, the recording will finish, and if the recording was frame perfect, the AI will land on the next node and the node controls will take over.

Some Odds and Ends


There are a few things you can do to tune this technique for your game.

It's highly recommended that you add an in-game path recording and deleting interface to help you easily build level pathing: Nomera takes about 10m to set up level pathing and its pretty fun too.

It's also convenient to have nodes extracted automatically. While you technically could do it yourself, adding automatic extraction makes the workflow VASTLY easier.

For fast retrieval of node parameters, Nomera stores all of the nodes in a hash table and all of the edges in lists per node. For easy display, edges are also stored in a master list to show their source/destination lines on the screen.

If you didn't notice already, static interactive pieces like ladders or ropes that aren't collidable objects are automatically handled by this technique. Let's say you need to press "up" to climb a ladder, if that "up" press is recorded and your AI uses a similar interface to the one previously proposed, it will register the input and get to climbing.

Wrap Up


We've looked at a way to guide AI around a platforming level that works regardless of collision geometry and allows AI to take the full potential of their platformer controls. First, we generate a pathing graph for a level, then we build a path from the graph, and finally we guide an AI across that path.

So does it work? Sure it does! Heres a gif:


Ynhun7J.gif
These guys were set to "hug mode." They're trying to climb into my skin wherever I go.


If you have any questions or suggestions, please shoot me an email at chris@dotstarmoney.com. Thanks for reading!

Update Log


27 Nov 2014: Initial Draft
4 Dec 2014: Removed a line unrelated to article content.

Calling Functions With Pre-Set Arguments in Modern C++

$
0
0

Introduction


A good fellow of mine gave me this interesting problem: pass a pre-stored set of arguments into a function without using std::function. I'd like to share with you my solution to this problem. Please, don't judge it strictly. I've never meant it to be perfect or finished for production use. Instead, I wanted to do everything as simple as possible, minimalistic but sufficient. Besides, there will be two solutions in this article. And one of them I like more than the other.

Implementation


Good Solution


The first way of solving the task exploits the fact that C++ already has a mechanism that allows us to capture variables. I talk about lambda functions. Of course, it would be great to use lambdas for this task. I'd show you a simple code snippet that has a lambda in it, just in case some of you are not familiar with C++14:

auto Variable = 1;

auto Lambda = [Variable]() {
    someFunction(Variable);
};

A lambda function is being created in this call. This lambda captures the value of the variable named Variable. The object of the lambda function is being copied into a variable named Lambda. One can later call the lambda through that variable. A call to lambda will look like this:

Lambda();

It seems at first that the problem is solved, but really it's not. A lambda function can be returned from a function, a method or another lambda function, but it is hard to pass a lambda as an argument unless the receiver of that argument is a template.

auto makeLambda(int Variable) {
    return [Variable]() {
        someFunction(Variable);
    };
}

auto Lambda = makeLambda(3);

// What should be the signature of someOtherFunction()?
someOtherFunction(Lambda);

Lambda functions are objects of anonymous types. They have an internal structure which only the compiler knows of. Pure C++ (I mean C++ as a language without its libraries) does not give a programmer much operations at hand:

  • a lambda can be called;
  • a lambda can be converted to a function pointer, when the lambda is not capturing anything;
  • a lambda can be copied.

Frankly speaking, these operations are more than enough, because there are other mechanisms in the language which when combined give us a lot of flexibility. Let me share with you the solution to the problem which I ended up with.

#include <utility>
#include <cstdint>
#include <vector>

template <typename Function> class SignalTraits;

template <typename R, typename... A> class SignalTraits<R(A...)> {
public:
  using Result = R;
};

template <typename Function> class Signal {
public:
  using Result = typename SignalTraits<Function>::Result;

  template <typename Callable> Signal(Callable Fn) : Storage(sizeof(Fn)) {
    new (Storage.data()) Callable(std::move(Fn));

    Trampoline = [](Signal *S) -> Result {
      auto CB = static_cast<Callable *>(static_cast<void *>(S->Storage.data()));
      return (*CB)();
    };
  }

  Result invoke() { return Trampoline(this); }

private:
  Result (*Trampoline)(Signal *Self);

  std::vector<std::uint8_t> Storage;
};

I'll explain briefly what is happening in that code snippet: the created non-capturing lambda function knows the type of Callable because it (the lambda) is being constructed in the template constructor. That's why the lambda is able to cast the data in Storage to the proper type. Really, that's it. All the hard lifting is done by the compiler. I consider this implementation to be simple and elegant.

Not So Good Solution


I like the other solution less, because it is filled with handmade stuff. And all that stuff is needed to capture variables, something C++ language already does for us out of the box. I don't want to spend a lot of words on this, so let me show you the implementation, which is large and clumsy.

#include <cstdarg>
#include <cstdint>
#include <vector>

template <typename T> struct PromotedTraits { using Type = T; };
template <> struct PromotedTraits<char> { using Type = int; };
template <> struct PromotedTraits<unsigned char> { using Type = unsigned; };
template <> struct PromotedTraits<short> { using Type = int; };
template <> struct PromotedTraits<unsigned short> { using Type = unsigned; };
template <> struct PromotedTraits<float> { using Type = double; };

template <typename... Arguments> class StorageHelper;

template <typename T, typename... Arguments>
class StorageHelper<T, Arguments...> {
public:
  static void store(va_list &List, std::vector<std::uint8_t> &Storage) {
    using Type = typename PromotedTraits<T>::Type;
    union {                                       
      T Value;                                    
      std::uint8_t Bytes[sizeof(void *)];         
    };                                            
    Value = va_arg(List, Type);
    for (auto B : Bytes) {
      Storage.push_back(B);
    }
    StorageHelper<Arguments...>::store(List, Storage);
  }
};

template <> class StorageHelper<> {
public:
  static void store(...) {}
};

template <bool, typename...> class InvokeHelper;

template <typename... Arguments> class InvokeHelper<true, Arguments...> {
public:
  template <typename Result>
  static Result invoke(Result (*Fn)(Arguments...), Arguments... Args) {
    return Fn(Args...);
  }
};

template <typename... Arguments> class InvokeHelper<false, Arguments...> {
public:
  template <typename Result> static Result invoke(...) { return {}; }
};

struct Dummy;

template <std::size_t Index, typename... Types> class TypeAt {
public:
  using Type = Dummy *;
};

template <std::size_t Index, typename T, typename... Types>
class TypeAt<Index, T, Types...> {
public:
  using Type = typename TypeAt<(Index - 1u), Types...>::Type;
};

template <typename T, typename... Types> class TypeAt<0u, T, Types...> {
public:
  using Type = T;
};

template <typename Function> class Signal;

template <typename Result, typename... Arguments>
class Signal<Result(Arguments...)> {
public:
  using CFunction = Result(Arguments...);

  Signal(CFunction *Delegate, Arguments... Values) : Delegate(Delegate) {
    initialize(Delegate, Values...);
  }

  Result invoke() {
    std::uintptr_t *Args = reinterpret_cast<std::uintptr_t *>(Storage.data());
    Result R = {};
    using T0 = typename TypeAt<0u, Arguments...>::Type;
    using T1 = typename TypeAt<0u, Arguments...>::Type;
    // ... and so on.
    switch (sizeof...(Arguments)) {
    case 0u:
      return InvokeHelper<(0u == sizeof...(Arguments)),
                          Arguments...>::template invoke<Result>(Delegate);
    case 1u:
      return InvokeHelper<(1u == sizeof...(Arguments)),
                          Arguments...>::template invoke<Result>(Delegate,
                                                                 (T0 &)Args[0]);
    case 2u:
      return InvokeHelper<(2u == sizeof...(Arguments)),
                          Arguments...>::template invoke<Result>(Delegate,
                                                                 (T0 &)Args[0],
                                                                 (T1 &)Args[1]);
      // ... and so on.
    }
    return R;
  }

private:
  void initialize(CFunction *Delegate, ...) {          
    va_list List;                                      
    va_start(List, Delegate);                          
    StorageHelper<Arguments...>::store(List, Storage); 
    va_end(List);                                      
  }                                                    

  CFunction *Delegate;

  std::vector<std::uint8_t> Storage; 
};

As for me, the only interesting things are the two helper classes: StorageHelper and InvokeHelper. The first class combines ellipsis with type list recursive algorithm to put arguments into Storage. The second class provides a type safe way of fetching arguments from that storage. And there's a tiny important detail: ellipsis promotes some types to others. I.e. float is promoted to double, char to int, short to int, etc.

Summary


I'd like to make a kind of a summary: I don't think the two solutions are perfect. They lack a lot and they try to reinvent the wheel. I'd say that the best way to pass pre-stored arguments into a function would be to use std::function + lambda. Though, as a mind exercise the problem is a lot of fun indeed.

I hope you liked what you read and learned something useful for you. Thanks a lot for reading!

Article Update Log


9 June 2015: Initial release

Cache In A Multi-Core Environment

$
0
0

Cache In A Multi-Core Environment


In my previous article I discussed the use of cache and some practices that can provide increased performance while also teaching you what cache is. I also stated that cache in a multicore environment is a whole other topic so I’ve written this article to cover the different considerations that come along with Multicore Programming.

Why does it matter if we’re using two cores?


Cache comes in levels, typically 3 each with their own group of cores that can access it, L1 Cache is only visible to a single core with each core having it’s own private cache and is the fastest of all caches. L2 Cache is usually visible to a group of cores, for instance the AMD 8150 shares L2 Cache between two cores and finally there’s L3 Cache that is accessible to all cores and is the slowest of caches, but still much faster in comparison to RAM.

Now that we know that there are different banks of cache for each core, what happens when two cores are accessing the same memory? If there was no system in place then both cores would cache the memory, then lets say one core wrote to that memory, This would be visible in memory, although the other core would still have it’s cache of the old value. To solve this when a core writes to it’s cached memory; Any other core that stores that cache line will be removed or updated, which is where our problem comes into play.

Let’s say you have 2 Integers on a single cache line and each core was writing to an integer each that are next to each other in an array, although they’re not the same variables and it won’t cause any unexpected results, because they’re on the same cache line. Every time one core writes to that memory, the other core loses its cache. This is referred to as False Sharing and there’s a simple solution to this, the hardest part is determining if you’re having this problem.

False Sharing


False Sharing can hinder the performance for any program. For this example I’ll go through the optimisations I did on a single producer single consumer queue and provide a few steps to solving most of your False Sharing problems. To test the queue I have two threads, one writing integers from 0 to 1 million and another reading them and checking if they’re all in order. The queue doesn’t undergo any resizing and is allocated with enough capacity for 1 million objects.

template<typedef T>
class alignas(64) Queue{
    T* data_;
    size_t push_position_;
    size_t pop_position_;
    std::atomic<size_t> size_;
    size_t capacity_;
};

The problem with this code is that all the variables are packed together with no spacing together, the whole structure would fit on up to two cache lines. This is perfect if we’re in a single core environment, although separate cores access pop_position and push_position therefor there’s high contention between these cache lines in a multicore Environment.

I break the problem down into a shared read section; shared write section and one section for each thread. A section may be larger than a single cache line and may require two cache lines to implement, it’s for this reason I call them a section. Our first step would be to determine what memory belongs to what section. With data_ and capacity_ both being shared, but rarely written to, they therefor belong to the shared read cache line, size_ is the only variable that is a shared write and push and pop both belong to their own cache line as each thread uses one each. In this example that leaves us with 4 cache lines. This leaves us with

template<typedef T>
class alignas(64) Queue{
    // Producers C-Line
    size_t push_position_;
    char pad_p[64 - sizeof(size_t)];
    // Consumers C-Line
    size_t pop_position_;
    char pad_c[64 - sizeof(size_t)];
    // Shared Read C-Line
    T* data_;
    size_t capacity_;
    char pad_sr[64 - sizeof(size_t) - sizeof(T*)];
    // Shared Write C-Line
    std::atomic<size_t> size_;
    char pad_sw[64 - sizeof(std::atomic<size_t>)];
};

Notice that the alignas(n) this is a new keyword added in C++14. The keyword ensures that the structure is aligned to a multiple of n bytes in memory and therefor allows us to assume that our first variable will be placed at the start of a cache line, which is vital for our separation.

Before accounting for False sharing, to push and pop 1 million Integers it took 60ms, but after accounting for False Sharing it’s been reduced to 34ms on a Intel Core I5 3210M @ 2.5Ghz. The majority of the time comes from the atomic access, which we use to check to see if there’s room to push and anything to pop. You could potentially optimise the atomic access out of most of the pushes by remembering how many objects can be pushed and popped until your next size check, this way we can lower the atomic access and dramatically improve performance again.

Example Source

While on the same subject of False Sharing, another example would occur when storing data within an array and having a number of threads access that array. Lets think about pool of threads which keep count how much work they’ve done and store it in an array. We need access to these variables to check how much work’s been done while running.

	int work_done[n];

An easy mistake to make, but would result in a plethora of cache misses. As each core goes to increment it’s work_done it would invalidate the other cores cache. A solution to this would be to turn the array into an array of pointers to store a pointer to a local variable inside the thread, this would require that we pass a pointer to work_done so we can populate that pointer with the address of the local variable. From a synthetic test where the worker thread is only iterating on work_done, we can see over 5 seconds of iteration across 4 cores we get a result of ~890M iterations per core while once we’d accounted for False Sharing and utilized local variables we get a result of ~1.8B iterations per core which is a ~2x improvement on the I5 3210M @ 2.5Ghz. The same test on an AMD 8150 @ 4.2Ghz reached 44M iterations with False Sharing, while without we reached 2.3B iterations which is a shocking ~52x improvement in speed, I had to double check this result because it’s left me in disbelief**! In this case we use a local variable instead of padding between all the variables to save space, but both would work equally as well.

Example Source


Summary


  • Keep classes with multicore access segmented by cache lines to eliminate False Sharing
  • Local variables are preferred over sharing data outside of the thread

Conclusion


False Sharing can be a problematic side affect of multicore programming which should be a consideration whenever two cores use data in proximity to one another. From these tests on an Intel 3210M we can see that by eliminating False Sharing we receive a ~2x performance boost, obviously this would differ on different hardware.

Notes


* AMD 8150 is tested on Windows 8.1 with Visual Studio 2013 and Intel 3210M is tested on OSX 10.10 LLVM 6.1.0.

** After seeing such a large difference, I went looking for a cause to such dramatic performance loss; I found that the L3 cache on the Bulldozer architecture is broken into 2MB per module (2 cores) that cannot be accessed by other modules [1]. Sharing would result in a cache miss all the way to RAM, while the I5 3210M shares it L3 Cache between all cores and would only need to go to the L3 cache in the case of a cache miss. This wouldn’t be a problem if the operating system had placed the threads onto the two cores in a module. I kept running the tests with 2 threads until the result went from 44M to 1.2B per thread, assuming that in these cases the threads were placed on the same module and therefor shared L3 cache. This is a perfect example of the importance of testing your software on different hardware.


[1] isscc.org/doc/2011/isscc2011.advanceprogrambooklet_abstracts.pdf pg. 40

Designing a Mobile Game Technology Stack

$
0
0
A lot of technology goes into developing stable, scalable mobile games. At Rumar Gaming we have invested a lot of time in building a solid platform before even thinking about game ideas. Our goal was to be able to develop a large variety of games in a short period of time by sharing the underlying technology stack.

This article describes the technology stack that we designed and that allows us to release new games rapidly without having to worry about non-gameplay functionality, databases or API hosting.

Stack overview


We separated the technology stack into three main tiers, each consisting of several sub tiers and I’ll discuss each one of them in more detail.

  1. The mobile app
  2. The back-end API
  3. The cloud hosting stack

This is a schematic overview of the stack:


Attached Image: technology_stack.jpg


1) The mobile app


When we decided to start Rumar Gaming there was no doubt that we would be using Xamarin for our mobile development. Our games need to support both iOS and Android, so using a cross-platform development environment can cut our development times significantly. In my opinion, Xamarin is by far the most mature option for cross-platform mobile development. Add the fact that I’m an expert at C# and already have experience developing games in Xamarin and it was a done deal.

The mobile app itself consists of three tiers (from the bottom up):

Rumar Framework

This is our custom framework which contains the interfaces and logic that are shared by all the games.

Aside from holding some utility classes, its main responsibility is communication with the API to handle - among other things - device registration, session management, score registration, in-app purchases and advertisements.

The framework is mainly cross-platform, but has some platform-specific functionality on top of it as well. For example, in-app purchases need to be handled differently in iOS and Android.

Game-specific logic

This tier contains cross platform, game-specific logic. We try to put as much of the game logic in here as possible so we only have to develop and manage it once for both platforms.

iOS- & Android-specific logic

You will always need to have separate projects for each of the supported platforms because of platform-specific logic that is required.

2) The back-end API


The games need a back-end that handles things like registration of devices, session management, push notifications, authentication and score tracking. Again, the goal here is to share as much logic as possible through one framework API, but some game-specific functions will get their own API.

We’ve decided to use the .NET Web API framework for this, mainly because of our long history with .NET. The main alternative for us was node.js, which would be somewhat easier to scale, but because of a limited development timeframe we decided not to take the risk of choosing a technology we are not yet comfortable with.

By hosting the API on Windows Server Core instances, we are still able to cut down on hosting costs. More on this will follow in the next section.

3) The cloud hosting stack


No one can predict if (one of) our games will become a hit, although we are certainly doing our best covering all grounds to increase our chances. If a game does become successful, the back-end must be highly scalable. It should not matter whether we have 10 users or 1 million users, the back-end should perform in the same way and it should not require a lot of effort (ideally, not any effort) to scale it up.

So we are hosting the back-end in “the cloud” and we have chosen Amazon Web Services (AWS) for this because we have been really satisfied using it in the past. I’m definitely not suggesting you should not look into other services like Microsoft Azure or Google Cloud Services! AWS was the best fit for us, but it may be different in your situation, so I encourage you to do a comparison yourself first.

Let’s take a look at the moving parts of our cloud hosting stack.

EC2

The API will be hosted on EC2 instances. EC2 stands for Elastic Computing Cloud and offers you virtual machines to host your application. They can be automatically scaled up and down depending on traffic and performance requirements, meaning that – during upscaling - new instances are automatically deployed and added to the load balancer.

By hosting our API on Windows Server Core instances we save money on both licensing and computing. Core instances require less system resources, are deployed faster and because you don’t get a full Windows interface you pay less money for their license (which is integrated in the costs per hour).

Cognito

Cognito is used for authentication and user management. It offers several authentication providers and out of the box functionality for user data synchronization.

When a player starts a game session, we can start storing user data (such as game preferences) on the device. If the player gets authenticated at some point – by creating an account or using a social login provider – the offline user data will be synchronized to the cloud.

S3

Amazon’s Simple Storage Service (S3) is used when an app requires to store blob data such as images or videos. The keyword here, again, is scalability; we don’t need to worry if we store 1 asset or 1 billion assets, it will just work and we only get billed for what we use.

SNS

SNS stands for Simple Notification Service and it’s used to register devices for push notifications and to send the notifications. It supports both iOS and Android so that’s perfect. You only pay when you are sending out notifications and even then it’s free for the first million notifications.

DynamoDB

DynamoDB is AWS’s answer to No-SQL databases. It will be used to keep track of game sessions, progress and high scores. No-SQL doesn’t necessarily have to be the best choice when developing a mobile API, but it is certainly the easiest to scale and very cheap in use. So taking that into account – scalability and cost – DynamoDB seems to be the best choice for us.

Bottom up approach


When talking about developing games, most people expect you to start with a game idea and design the rest around that. The question I get the most from my acquaintances is “do you guys have any cool game ideas yet?”

Well yes, we do have some rough ideas, but that’s not what we are focusing on in the beginning. We are taking a bottom up approach, meaning that we start with setting up the cloud hosting stack, then we develop the framework API and we slowly work our way up to the game logic.

Even though we are really excited to start working on the actual games – which is definitely the most fun thing to work on - in order to create something that will scale and is future proof, we must start at the bottom.

Cost estimation


The monthly cost of this stack depends heavily on the size of your userbase and the requirements of your API, but I have worked out an estimation based on some assumptions.

Development
During development you're good to go with the Free Tier; the free tier is available for the first 12 months.
The numbers below are based on monthly use.

EC2
  • 750 hours per month of EC2 time (so that's one instance for a full month)
  • t2.micro instance: 1 vCPU with 1 GB RAM (you can run Windows Core on this)

S3
  • 5 GB storage
  • 15 GB data traffic
  • 20.000 Get requests
  • 2.000 Put requests

SNS
  • Up to 1 million push notifications sent.

Cognito
  • 1 million sync requests per month
  • 10 GB sync storage

Production scenario

I'm making the following assumptions:
  • You have 1.000 daily users.
  • Users generate 10.000 sessions daily.
  • Users generate 500.000 API requests daily.
  • Each daily user is unique (for sake of Cognito calculation)
  • A user profile contains 100kb of data.
  • Each user received 10 push notifications daily.
  • Each API request triggers 5 database requests.


EC2
  • 500.000 API requests daily will average to around 6 requests per second.
  • Your API can run fine on a 1 vCPU / 4GB RAM system.
  • In that case a t2.medium instance will suffice, total costs: $56
  • Scaling works by adding more machines, thus multiplying these costs.

Cognito
  • Monthly sync operations: 10.000 sessions * 31 days * 2 syncs per session = 620.000
  • Monthly charged: (620.000 / 10.000) * $0.15 = $9.30
  • Profile storage: 31.000 users * 100kb = 3.1 GB * $0.15 = $0.47
  • Free tier for the first 12 months!
  • After that: $9.80

SNS
  • Monthly notifications: 31.000 users * 31 days * 10 notifications = 9.61 million
  • Monthly charge = 9.61 * $0.50 = $4.80

DynamoDB
  • Total requests: 500.000 API requests * 5 databases requests * 31 days = 77.5 million
  • Total storage: 10 GB
  • Free tier for the first 12 months!
  • After that: $10 (very hard to estimate, but it's on the high end)

MONTHLY COST: $60.80 (after free tier: $80.60)
If your API requires redundant servers: $116.80 (after free tier: $136.60)


Additional

This is assuming your need blog storage for your game:
  • You need 1 TB of blob storage, each user does 100 put+get requests daily.
  • You want full backup of blob storage (highest price).

S3
  • Storage: 1 TB = $30
  • Requests (100 GET + 100 PUT per user daily): 3.1 million GET + 3.1 million PUT = $31
  • Total: $61


I hope you enjoyed this article and can put it to good use during your own mobile game projects. As development of Rumar Gaming progresses, I will regularly write new articles on what we are doing and how we are solving common issues to you run into during (mobile) game development. Any comments and questions are more than welcome and I’ll be happy to give you my feedback on them!


This article was originally posted, in slight different form, on the Rumar Gaming Blog.

Coverage Buffer as main Occlusion Culling technique

$
0
0

Introduction


Recently I came across a awesome presentation from Crytek named Secrets of CryEGNINE 3 Graphics Technology authored by Nickolay Kasyan, Nicolas Schulz и Tiago Sousa. In this paper I've found a brief description of a technique called Coverage Buffer.
You can find whole presentation HERE.
This technology was presented as main occlusion culling method, actively used since Crysis 2. And, since there was no detailed paper about this technology, I decided to dig into this matter myself.


Coverage Buffer - Occlusion Culling technique


Overview


Main idea of method was clearly stated by Crytek presentation I mentioned before:
  • Get depth buffer from previous frame
  • Make reprojection to current frame
  • Softwarely rasterize BBoxes of objects to check, whether they can be seen from camera perspective or not - and, based on this test, make a decision to draw or not to draw.

There's, of course, nothing revolutionary about this concept. There's another very similar method called Software Occlusion Culling. But there are few differences between these methods, and a crucial one is that in SOC we must separate objects into two different categories - occluders and occludee, which is not always can be done.

Let's see some examples.
If we have FPS game level, like Doom 3, we have corridors, which are perfect occluders, and objects - barrels, ammo, characters, which are, in turn, perfect occludees. In this case we have a clear approach - to test objects' BBoxes agains corridors.
But what if we have, let's say, massive forest. Every tree can be both occluder - imagine large tree right in front of camera, which occludes all other world behind it, - and occludee - when some other tree occludes it. In case of forest we cannot use SOC in its pure form, it'd be counterproductive.

Attached Image: y4voewu.png

So, summarizing cons and pros of Coverage Buffer:

PROS:
  • we need not to separate objects into occluders/occludee
  • we can use already filled depth buffer from previous frame, we need not to rasterize large occluder's BBoxes
CONS:
  • small artifacts, caused by 1 frame delay (even reprojection doesn't completely solve it)
  • small overhead if there's no occlusion happened (that, I guess, is common for all OC methods I know, but still)


Choice


When I started to investigate this matter, it wasn't out of pure academic interest. On a existing and live project there was a particular problem, which needed to be solved. Large procedural forest caused giant lags because of overdraw issue (Dx9 alpha-test stage was disabled due to other issues, which are not discussed in this article, and in Dx11 alpha test kills Early-Z, which also causes massive overdraw).

Here's a short summary of initial problem:
  • We need to draw an island, full of different, procedural trees. (Engine used is Torque3D)

Engine by default offers nice batching system, which batches distant trees into... well, batches, but decisions about "draw/no draw" is taken based on frustum culling results only. Also, distant trees are rendering as billboards-imposters, which is also a nice optimization.
But this approach is not so effective, when we deal with large forest with thousands of trees. In this case there's a lot of overdraw done: batches behind mountains, batches behind the wall, batches behind other trees and so on. All of these overdraws cause FPS to drop gravely: even if we look through wall in the direction towards the center of an island, drawing of invisible trees took about 20-30ms.
As a result, players got a dramatic FPS drop by just looking towards the center of an isle.


Attached Image: 2yyqxc7.jpg

Attached Image: 100951_1413924340_life_is_feudal_map_with_coordinates.jpg


To solve this particular issue it's been decided to use Coverage Buffer. I cannot say that I did not have doubts about this decision, but Crytek recommendations overruled all my other suggestions. Besides, CB fits into this particular issue like a glove - why not try it?

Implementation


Let's proceed to technical details and code.

Obtaining Depth Buffer.

First task was to obtain depth buffer. In Dx11 it's no difficult task. In Dx9 it's also not so difficult, there's a certain hack (found in Aras Pranckevičius blog, it's a guy, who runs render in Unity3D). Here's link: http://aras-p.info/texts/D3D9GPUHacks.html
It appears, that one CAN obtain depth buffer, but only with special format - INTZ. According to official NVidia and AMD papers, most of videocards since 2008 support this feature. For earlier cards there's RAWZ - another hacky format.
Links to papers:
http://amd-dev.wpengine.netdna-cdn.com/wordpress/media/2012/10/Advanced-DX9-Capabilities-for-ATI-Radeon-Cards_v2.pdf
http://developer.download.nvidia.com/GPU_Programming_Guide/GPU_Programming_Guide_G80.pdf

Usage code is trivial, but I'll put it here - just in case:

#define FOURCC_INTZ ((D3DFORMAT)(MAKEFOURCC('I','T','N','Z')))

// Determine if INTZ is supported
HRESULT hr;
hr = pd3d->CheckDeviceFormat(AdapterOrdinal, DeviceType, AdapterFormat,
 D3DUSAGE_DEPTHSTENCIL, D3DRTYPE_TEXTURE,
FOURCC_INTZ);
BOOL bINTZDepthStencilTexturesSupported = (hr == D3D_OK);

// Create an INTZ depth stencil texture
IDirect3DTexture9 *pINTZDST;
pd3dDevice->CreateTexture(dwWidth, dwHeight, 1,
 D3DUSAGE_DEPTHSTENCIL, FOURCC_INTZ,
 D3DPOOL_DEFAULT, &pINTZDST,
 NULL);

// Retrieve depth buffer surface from texture interface
IDirect3DSurface9 *pINTZDSTSurface;
pINTZDST->GetSurfaceLevel(0, &pINTZDSTSurface);

// Bind depth buffer
pd3dDevice->SetDepthStencilSurface(pINTZDSTSurface);

// Bind depth buffer texture
pd3dDevice->SetTexture(0, pINTZDST);

Next step is processing depth buffer, so we could use it.

Processing depth buffer.

  • downscale to low resolution (I picked 256x128)
  • reprojection

These steps are trivial. Downscale is performed with operator max - we're taking the elowest distance to camera, so we wouldn't occlude any of actually visible objects.
Reprojection is performed by applying inverted ViewProjection matrix of previous frame and applying ViewProjection matrix of current frame to results. Gaps are filled with maxValue to prevent artificial occlusion.

Here's some useful parts of code for reprojection:
float3 reconstructPos(Texture2D depthTexture, float2 texCoord, float4x4 matrixProjectionInverted )
{
	float depth = 1-depthTexture.Sample( samplerDefault, texCoord ).r;
		
	float2 cspos = float2(texCoord.x * 2 - 1, (1-texCoord.y) * 2 - 1);
	float4 depthCoord = float4(cspos, depth, 1);
	depthCoord = mul (matrixProjectionInverted, depthCoord);
	
	return depthCoord.xyz / depthCoord.w;
}
Projection performed trivially.

Software rasterization

This topic is well known and already implemented a lot of times. Best info which I could find was here:
https://software.intel.com/en-us/blogs/2013/09/06/software-occlusion-culling-update-2

But, just to gather all eggs in one basket, I'll provide my code, which was originally implemented in plain c++, and later translated to SSE, after which it became approximately 3 times faster.
My SSE is far from perfect, so, if you find any mistakes or places for optimization - please tell me =)

static const int sBBIndexList[36] =
{
  // index for top 
  4, 8, 7,
  4, 7, 3,

  // index for bottom
  5, 1, 2,
  5, 2, 6,

  // index for left
  5, 8, 4,
  5, 4, 1,

  // index for right
  2, 3, 7,
  2, 7, 6,

  // index for back
  6, 7, 8,
  6, 8, 5,

  // index for front
  1, 4, 3,
  1, 3, 2,
};

__m128 SSETransformCoords(__m128 *v, __m128 *m)
{
  __m128 vResult = _mm_shuffle_ps(*v, *v, _MM_SHUFFLE(0,0,0,0));
  vResult = _mm_mul_ps(vResult, m[0]);

  __m128 vTemp = _mm_shuffle_ps(*v, *v, _MM_SHUFFLE(1,1,1,1));
  vTemp = _mm_mul_ps(vTemp, m[1]);

  vResult = _mm_add_ps(vResult, vTemp);
  vTemp = _mm_shuffle_ps(*v, *v, _MM_SHUFFLE(2,2,2,2));

  vTemp = _mm_mul_ps(vTemp, m[2]);
  vResult = _mm_add_ps(vResult, vTemp);

  vResult = _mm_add_ps(vResult, m[3]);
  return vResult;
}

__forceinline __m128i Min(const __m128i &v0, const __m128i &v1)
{
  __m128i tmp;
  tmp = _mm_min_epi32(v0, v1);
  return tmp;
}
__forceinline __m128i Max(const __m128i &v0, const __m128i &v1)
{
  __m128i tmp;
  tmp = _mm_max_epi32(v0, v1);
  return tmp;
}


struct SSEVFloat4
{
  __m128 X;
  __m128 Y;
  __m128 Z;
  __m128 W;
};

// get 4 triangles from vertices
void SSEGather(SSEVFloat4 pOut[3], int triId, const __m128 xformedPos[])
{
  for(int i = 0; i < 3; i++)
  {
    int ind0 = sBBIndexList[triId*3 + i + 0]-1;
    int ind1 = sBBIndexList[triId*3 + i + 3]-1;
    int ind2 = sBBIndexList[triId*3 + i + 6]-1;
    int ind3 = sBBIndexList[triId*3 + i + 9]-1;

    __m128 v0 = xformedPos[ind0];
    __m128 v1 = xformedPos[ind1];
    __m128 v2 = xformedPos[ind2];
    __m128 v3 = xformedPos[ind3];
    _MM_TRANSPOSE4_PS(v0, v1, v2, v3);
    pOut[i].X = v0;
    pOut[i].Y = v1;
    pOut[i].Z = v2;
    pOut[i].W = v3;

    //now X contains X0 x1 x2 x3, Y - Y0 Y1 Y2 Y3 and so on...
  }
}


bool RasterizeTestBBoxSSE(Box3F box, __m128* matrix, float* buffer, Point4I res)
{
  //TODO: performance
  LARGE_INTEGER frequency;        // ticks per second
  LARGE_INTEGER t1, t2;           // ticks
  double elapsedTime;

  // get ticks per second
  QueryPerformanceFrequency(&frequency);

  // start timer
  QueryPerformanceCounter(&t1);


  //verts and flags
  __m128 verticesSSE[8];
  int flags[8];
  static Point4F vertices[8];
  static Point4F xformedPos[3];
  static int flagsLoc[3];

  // Set DAZ and FZ MXCSR bits to flush denormals to zero (i.e., make it faster)
  // Denormal are zero (DAZ) is bit 6 and Flush to zero (FZ) is bit 15. 
  // so to enable the two to have to set bits 6 and 15 which 1000 0000 0100 0000 = 0x8040
  _mm_setcsr( _mm_getcsr() | 0x8040 );


  // init vertices
  Point3F center = box.getCenter();
  Point3F extent = box.getExtents();
  Point4F vCenter = Point4F(center.x, center.y, center.z, 1.0);
  Point4F vHalf   = Point4F(extent.x*0.5, extent.y*0.5, extent.z*0.5, 1.0);

  Point4F vMin    = vCenter - vHalf;
  Point4F vMax    = vCenter + vHalf;

  // fill vertices
  vertices[0] = Point4F(vMin.x, vMin.y, vMin.z, 1);
  vertices[1] = Point4F(vMax.x, vMin.y, vMin.z, 1);
  vertices[2] = Point4F(vMax.x, vMax.y, vMin.z, 1);
  vertices[3] = Point4F(vMin.x, vMax.y, vMin.z, 1);
  vertices[4] = Point4F(vMin.x, vMin.y, vMax.z, 1);
  vertices[5] = Point4F(vMax.x, vMin.y, vMax.z, 1);
  vertices[6] = Point4F(vMax.x, vMax.y, vMax.z, 1);
  vertices[7] = Point4F(vMin.x, vMax.y, vMax.z, 1);

  // transforms
  for(int i = 0; i < 8; i++)
  {
    verticesSSE[i] = _mm_loadu_ps(vertices[i]);

    verticesSSE[i] = SSETransformCoords(&verticesSSE[i], matrix);

    __m128 vertX = _mm_shuffle_ps(verticesSSE[i], verticesSSE[i], _MM_SHUFFLE(0,0,0,0)); // xxxx
    __m128 vertY = _mm_shuffle_ps(verticesSSE[i], verticesSSE[i], _MM_SHUFFLE(1,1,1,1)); // yyyy
    __m128 vertZ = _mm_shuffle_ps(verticesSSE[i], verticesSSE[i], _MM_SHUFFLE(2,2,2,2)); // zzzz
    __m128 vertW = _mm_shuffle_ps(verticesSSE[i], verticesSSE[i], _MM_SHUFFLE(3,3,3,3)); // wwww
    static const __m128 sign_mask = _mm_set1_ps(-0.f); // -0.f = 1 << 31
    vertW = _mm_andnot_ps(sign_mask, vertW); // abs
    vertW = _mm_shuffle_ps(vertW, _mm_set1_ps(1.0f), _MM_SHUFFLE(0,0,0,0)); //w,w,1,1
    vertW = _mm_shuffle_ps(vertW, vertW, _MM_SHUFFLE(3,0,0,0)); //w,w,w,1
  
    // project
    verticesSSE[i] = _mm_div_ps(verticesSSE[i], vertW);

    // now vertices are between -1 and 1
    const __m128 sadd = _mm_setr_ps(res.x*0.5, res.y*0.5, 0, 0);
    const __m128 smult = _mm_setr_ps(res.x*0.5, res.y*(-0.5), 1, 1);

    verticesSSE[i] = _mm_add_ps( sadd, _mm_mul_ps(verticesSSE[i],smult) );
  }

  // Rasterize the AABB triangles 4 at a time
  for(int i = 0; i < 12; i += 4)
  {
    SSEVFloat4 xformedPos[3];
    SSEGather(xformedPos, i, verticesSSE);

    // by 3 vertices
    // fxPtX[0] = X0 X1 X2 X3 of 1st vert in 4 triangles
    // fxPtX[1] = X0 X1 X2 X3 of 2nd vert in 4 triangles
    // and so on
    __m128i fxPtX[3], fxPtY[3];
    for(int m = 0; m < 3; m++)
    {
      fxPtX[m] = _mm_cvtps_epi32(xformedPos[m].X);
      fxPtY[m] = _mm_cvtps_epi32(xformedPos[m].Y);
    }

    // Fab(x, y) =     Ax       +       By     +      C              = 0
    // Fab(x, y) = (ya - yb)x   +   (xb - xa)y + (xa * yb - xb * ya) = 0
    // Compute A = (ya - yb) for the 3 line segments that make up each triangle
    __m128i A0 = _mm_sub_epi32(fxPtY[1], fxPtY[2]);
    __m128i A1 = _mm_sub_epi32(fxPtY[2], fxPtY[0]);
    __m128i A2 = _mm_sub_epi32(fxPtY[0], fxPtY[1]);

    // Compute B = (xb - xa) for the 3 line segments that make up each triangle
    __m128i B0 = _mm_sub_epi32(fxPtX[2], fxPtX[1]);
    __m128i B1 = _mm_sub_epi32(fxPtX[0], fxPtX[2]);
    __m128i B2 = _mm_sub_epi32(fxPtX[1], fxPtX[0]);

    // Compute C = (xa * yb - xb * ya) for the 3 line segments that make up each triangle
    __m128i C0 = _mm_sub_epi32(_mm_mullo_epi32(fxPtX[1], fxPtY[2]), _mm_mullo_epi32(fxPtX[2], fxPtY[1]));
    __m128i C1 = _mm_sub_epi32(_mm_mullo_epi32(fxPtX[2], fxPtY[0]), _mm_mullo_epi32(fxPtX[0], fxPtY[2]));
    __m128i C2 = _mm_sub_epi32(_mm_mullo_epi32(fxPtX[0], fxPtY[1]), _mm_mullo_epi32(fxPtX[1], fxPtY[0]));

    // Compute triangle area
    __m128i triArea = _mm_mullo_epi32(B2, A1);
    triArea = _mm_sub_epi32(triArea, _mm_mullo_epi32(B1, A2));
    __m128 oneOverTriArea = _mm_div_ps(_mm_set1_ps(1.0f), _mm_cvtepi32_ps(triArea));

    __m128 Z[3];
    Z[0] = xformedPos[0].W;
    Z[1] = _mm_mul_ps(_mm_sub_ps(xformedPos[1].W, Z[0]), oneOverTriArea);
    Z[2] = _mm_mul_ps(_mm_sub_ps(xformedPos[2].W, Z[0]), oneOverTriArea);

    // Use bounding box traversal strategy to determine which pixels to rasterize 
    __m128i startX =  _mm_and_si128(Max(Min(Min(fxPtX[0], fxPtX[1]), fxPtX[2]),  _mm_set1_epi32(0)), _mm_set1_epi32(~1));
    __m128i endX   = Min(Max(Max(fxPtX[0], fxPtX[1]), fxPtX[2]), _mm_set1_epi32(res.x - 1));

    __m128i startY = _mm_and_si128(Max(Min(Min(fxPtY[0], fxPtY[1]), fxPtY[2]), _mm_set1_epi32(0)), _mm_set1_epi32(~1));
    __m128i endY   = Min(Max(Max(fxPtY[0], fxPtY[1]), fxPtY[2]), _mm_set1_epi32(res.y - 1));

    // Now we have 4 triangles set up.  Rasterize them each individually.
    for(int lane=0; lane < 4; lane++)
    {
      // Skip triangle if area is zero 
      if(triArea.m128i_i32[lane] <= 0)
      {
        continue;
      }

      // Extract this triangle's properties from the SIMD versions
      __m128 zz[3];
      for(int vv = 0; vv < 3; vv++)
      {
        zz[vv] = _mm_set1_ps(Z[vv].m128_f32[lane]);
      }

      //drop culled triangle

      int startXx = startX.m128i_i32[lane];
      int endXx  = endX.m128i_i32[lane];
      int startYy = startY.m128i_i32[lane];
      int endYy  = endY.m128i_i32[lane];

      __m128i aa0 = _mm_set1_epi32(A0.m128i_i32[lane]);
      __m128i aa1 = _mm_set1_epi32(A1.m128i_i32[lane]);
      __m128i aa2 = _mm_set1_epi32(A2.m128i_i32[lane]);

      __m128i bb0 = _mm_set1_epi32(B0.m128i_i32[lane]);
      __m128i bb1 = _mm_set1_epi32(B1.m128i_i32[lane]);
      __m128i bb2 = _mm_set1_epi32(B2.m128i_i32[lane]);

      __m128i cc0 = _mm_set1_epi32(C0.m128i_i32[lane]);
      __m128i cc1 = _mm_set1_epi32(C1.m128i_i32[lane]);
      __m128i cc2 = _mm_set1_epi32(C2.m128i_i32[lane]);

      __m128i aa0Inc = _mm_mul_epi32(aa0, _mm_setr_epi32(1,2,3,4));
      __m128i aa1Inc = _mm_mul_epi32(aa1, _mm_setr_epi32(1,2,3,4));
      __m128i aa2Inc = _mm_mul_epi32(aa2, _mm_setr_epi32(1,2,3,4));

      __m128i alpha0 = _mm_add_epi32(_mm_mul_epi32(aa0, _mm_set1_epi32(startXx)), _mm_mul_epi32(bb0, _mm_set1_epi32(startYy)));
      alpha0 = _mm_add_epi32(cc0, alpha0);
      __m128i beta0 = _mm_add_epi32(_mm_mul_epi32(aa1, _mm_set1_epi32(startXx)), _mm_mul_epi32(bb1, _mm_set1_epi32(startYy)));
      beta0 = _mm_add_epi32(cc1, beta0);
      __m128i gama0 = _mm_add_epi32(_mm_mul_epi32(aa2, _mm_set1_epi32(startXx)), _mm_mul_epi32(bb2, _mm_set1_epi32(startYy)));
      gama0 = _mm_add_epi32(cc2, gama0);

      int  rowIdx = (startYy * res.x + startXx);

      __m128 zx = _mm_mul_ps(_mm_cvtepi32_ps(aa1), zz[1]);
      zx = _mm_add_ps(zx, _mm_mul_ps(_mm_cvtepi32_ps(aa2), zz[2]));
      zx = _mm_mul_ps(zx, _mm_setr_ps(1.f, 2.f, 3.f, 4.f));

      // Texels traverse
      for(int r = startYy; r < endYy; r++,
        rowIdx += res.x,
        alpha0 = _mm_add_epi32(alpha0, bb0),
        beta0 = _mm_add_epi32(beta0, bb1),
        gama0 = _mm_add_epi32(gama0, bb2))
      {
        // Compute barycentric coordinates
        // Z0 as an origin
        int index = rowIdx;
        __m128i alpha = alpha0;
        __m128i beta = beta0;
        __m128i gama = gama0;

        //Compute barycentric-interpolated depth
        __m128 depth = zz[0];
        depth = _mm_add_ps(depth, _mm_mul_ps(_mm_cvtepi32_ps(beta), zz[1]));
        depth = _mm_add_ps(depth, _mm_mul_ps(_mm_cvtepi32_ps(gama), zz[2]));
        __m128i anyOut = _mm_setzero_si128();

        __m128i mask;
        __m128 previousDepth;
        __m128 depthMask;
        __m128i finalMask;
        for(int c = startXx; c < endXx;
          c+=4,
          index+=4,
          alpha = _mm_add_epi32(alpha, aa0Inc),
          beta  = _mm_add_epi32(beta, aa1Inc),
          gama  = _mm_add_epi32(gama, aa2Inc),
          depth = _mm_add_ps(depth, zx))
        {
          mask = _mm_or_si128(_mm_or_si128(alpha, beta), gama);
          previousDepth = _mm_loadu_ps(&(buffer[index]));

          //calculate current depth
          //(log(depth) - -6.907755375) * 0.048254941;
          __m128 curdepth = _mm_mul_ps(_mm_sub_ps(log_ps(depth),_mm_set1_ps(-6.907755375)),_mm_set1_ps(0.048254941));
          curdepth = _mm_sub_ps(curdepth, _mm_set1_ps(0.05));      

          depthMask = _mm_cmplt_ps(curdepth, previousDepth);    
          finalMask = _mm_andnot_si128(mask, _mm_castps_si128(depthMask));
          anyOut = _mm_or_si128(anyOut, finalMask);

        }//for each column  

        if(!_mm_testz_si128(anyOut, _mm_set1_epi32(0x80000000)))
        {
          // stop timer
          QueryPerformanceCounter(&t2);

          // compute and print the elapsed time in millisec
          elapsedTime = (t2.QuadPart - t1.QuadPart) * 1000.0 / frequency.QuadPart;

          RasterizationStats::RasterizeSSETimeSpent += elapsedTime;

          return true; //early exit
        }

      }// for each row

    }// for each triangle
  }// for each set of SIMD# triangles

  return false;
}

Now we have Coverage Buffer technique up and running.


Results


Using C-Buffer for Occlusion Culling in our particular case reduced frame render time by 10-20 ms (and in some cases even more). But it also gave about 2ms overhead in "nothing culled" case.

Attached Image: 100965_1413986120_panorama.jpg

This method was useful in our case, but it doesn't mean, that it can be used in all other cases. Actually, it puzzles me, how Crytek used it in Crysis 2 - imho, CB-unfriendly game. Perhaps I took some of it concepts wrong? Well, maybe =)

So, as it appears to me, main restriction for this method would be:

Do not use it unless you want to cull something, that takes forever to render (like forest with overdraw, for instance). CPU rasterization is a costly matter, and it's not worth it, when its applied to a simple easy-to-render objects with gpu-cheap materials.

How the PVS-Studio Team Improved Unreal Engine's Code

$
0
0
This article was originally published at Unreal Engine Blog. Republished by the editors' permission.

Our company develops, promotes, and sells the PVS-Studio static code analyzer for C/C++ programmers. However, our collaboration with customers is not limited solely to selling PVS-Studio licenses. For example, we often take on contract projects as well. Due to NDAs, we're not usually allowed to reveal details about this work, and you might not be familiar with the projects names, anyway. But this time, we think you'll be excited by our latest collaboration. Together with Epic Games, we're working on the Unreal Engine project. This is what we're going to tell you about in this article.

As a way of promoting our PVS-Studio static code analyzer, we've thought of an interesting format for our articles: We analyze open-source projects and write about the bugs we manage to find there. Take a look at this updatable list of projects we have already checked and written about. This activity benefits everyone: readers enjoy learning from others' mistakes and discover new means to avoid them through certain coding techniques and style. For us, it's a way to have more people learn about our tool. As for the project authors, they too benefit by gaining an opportunity to fix some of the bugs.

Among the articles was "A Long-Awaited Check of Unreal Engine 4". Unreal Engine's source code was extraordinarily high quality, but all software projects have defects and PVS-Studio is excellent at surfacing some of the most tricky bugs. We ran an analysis and reported our findings to Epic. The Unreal Engine team thanked us for checking their code, and quickly fixed the bugs we reported. But we didn't want to stop there, and thought we should try selling a PVS-Studio license to Epic Games.

Epic Games was very interested in using PVS-Studio to improve the engine continuously over time. They suggested we analyze and fix Unreal Engine's source code so that they were completely clear of bugs and the tool wouldn't generate any false positives in the end. Afterwords, Epic would use PVS-Studio on their code base themselves, thus making its integration into their development process as easy and smooth as possible. Epic Games promised to not only purchase the PVS-Studio license, but would also pay us for our work.

We accepted the offer. The job is done. And now you are welcome to learn about various interesting things we came across while working on Unreal Engine's source code.

Pavel Eremeev, Svyatoslav Razmyslov, and Anton Tokarev were the participants on the PVS-Studio's part. On the Epic Game's, the most active participants were Andy Bayle and Dan O'Connor - it all would have been impossible without their help, so many thanks to them!

PVS-Studio integration into Unreal Engine's build process


To manage the build process, Unreal Engine employs a build system of its own - Unreal Build Tool. There is also a set of scripts to generate project files for a number of different platforms and compilers. Since PVS-Studio is first of all designed to work with the Microsoft Visual C++ compiler, we used the corresponding script to generate project files (*.vcxproj) for the Microsoft Visual Studio IDE.

PVS-Studio comes with a plugin that can integrate into the Visual Studio IDE and enables a "one-click" analysis. However, projects generated for Unreal Engine are not the "ordinary" MSBuild projects used by Visual Studio.

When compiling Unreal Engine from Visual Studio, the IDE invokes MSBuild when starting the build process, but MSBuild itself is used just as a "wrapper" to run the Unreal Build Tool program.

To analyze the source code in PVS-Studio, the tool needs a preprocessor's output - an *.i file with all the headers included and macros expanded.

Quick note. This section is only interesting if you have a customized build process like Unreal's If you are thinking of trying PVS-Studio on a project of yours that has some intricate peculiarities about its build process, I recommend reading this section to the end. Perhaps it will be helpful for your case. But if you have an ordinary Visual Studio project or can't wait to read about the bugs we have found, you can skip it.

To launch the preprocessor correctly, the tool needs information about compilation parameters. In "ordinary" MSBuild projects, this information is inherent; the PVS-Studio plugin can "see" it and automatically preprocess all the necessary source files for the analyzer that will be called afterwards. With Unreal Engine projects, things are different.

As I've already said above, their projects are just a "wrapper" while the compiler is actually called by Unreal Build Tool. That's why compilation parameters in this case are not available for the PVS-Studio plugin for Visual Studio. You just can't run analysis "in one click", though the plugin can be used to view the analysis results.

The analyzer itself (PVS-Studio.exe) is a command-line application that resembles the C++ compiler regarding the way it is used. Just like the compiler, it has to be launched individually for every source file, passing this file's compilation parameters through the command line or response file. And the analyzer will automatically choose and call the appropriate preprocessor and then perform the analysis.

Note. There's also an alternative way. You can launch the analyzer for preprocessed files prepared in advance.

Thus, the universal solution for integrating the PVS-Studio analyzer into the build process is to call its exe-file in the same place where the compiler is called, i.e. inside the build system - Unreal Build Tool in our case. Sure, it will require modifying the current build system, which may not be desirable, as in our case. Because of that, just for cases like this, we created a compiler call "intercepting" system - Compiler Monitoring.

The Compiler Monitoring system can "intercept" compilation process launches (in the case with Visual C++, this is the cl.exe proces), collecting all of the parameters necessary for successful preprocessing, then re-launch preprocessing for files under compilation for further analysis. That's what we did.


Attached Image: image2.png
Figure 1. A scheme of the analysis process for the Unreal Engine project


Unreal Engine analysis integration comes down to calling, right before the build process, the monitoring process (CLMonitor.exe) that will make all the necessary steps to do the preprocessing and launch the analyzer at the end of the build process. To run the monitoring process, we need to run a simple command:

CLMonitor.exe monitor

CLMonitor.exe will call itself in "tracking mode" and terminate. At the same time, another CLMonitor.exe process will remain running in the background "intercepting" the compiler calls. When the build process is finished, we need to run another simple command:

CLMonitor.exe analyze "UE.plog"

Please pay attention: in PVS-Studio 5.26 and above you should write:

CLMonitor.exe analyze -l "UE.plog"

Now CLMonitor.exe will launch the analysis of previously-collected source files, saving the results into the UE.plog file that can be easily handled in our IDE plugin.

We set a nightly build process of the most interesting Unreal Engine configurations followed by their analysis on our Continuous Integration server. It was a means for us to, first, make sure our edits hadn't broken the build and, second, to get in the morning a new log about Unreal Engine's analysis with all the edits of the previous day taken into account. So, before sending a Pull Request for submitting our edits to the Unreal Engine project repository on GitHub, we could easily make sure that the current version was stable in our repository by simply rebuilding it on the server.

Non-linear bug fixing speed


So, we have solved the project build process and analysis. Now let's talk about bug fixes we've done based on the diagnostic messages output by the analyzer.

At first glance, it may seem natural that the number of warnings output by the analyzer should drop evenly from day to day: about the same number of messages is suppressed by certain PVS-Studio mechanisms as the number of fixes that are done in the code.

That is, theoretically you could expect a graph looking somewhat like this:


Attached Image: image3.png
Figure 2. A perfect graph. The number of bugs drops evenly from day to day.


In reality, however, messages are eliminated faster during the initial phase of the bug fixing process than at the later stages. First, at the initial stage, we suppress warnings triggered by macros, which helps quickly reduce the overall number of issues. Second, it happened so that we had fixed the most evident issues first and put off more intricate things until later. I can explain on this. We wanted to show the Epic Games developers that we had started working and there was a progress. It would be strange to start with difficult issues and get stuck there, wouldn't it?

It took us 17 working days in total analyzing the Unreal Engine code and fixing bugs. Our goal was to eliminate all the general analysis messages of the first and second severity levels. Here is how the work progressed:


Attached Image: image4.png
Table 1. The number of warnings remaining on each day.


Notice the red figures. During the first two days, we were getting accustomed to the project and then suppressed warnings in some macros, thus greatly reducing the number of false positives.

Seventeen working days is quite a lot and I'd like to explain why it required this amount of time. First, it was not the whole team that worked on the project, but only two of its members. Of course, they were busy with some other tasks as well during this time. Secondly, Unreal Engine's code was entirely unfamiliar to us, so making fixes was quite a tough job. We had to stop every now and then to figure out if and how we should fix a certain spot.

Now, here is the same data in the form of a smoothed graph:


Attached Image: image5.png
Figure 3. A smoothed graph of the warning numbers over time.


A practical conclusion - to remember ourselves and tell others: It's a bad idea to try estimating the time it will take you to fix all the warnings based on only the first couple of days of work. It's very pacey at first, so the forecast may appear too optimistic.

But we still needed to make an estimate somehow. I think there should be a magical formula for this, and hopefully we'll discover it and show it to the world someday. But presently, we are too short of statistical data to offer something reliable.

About the bugs found in the project


We have fixed quite a lot of code fragments. These fixes can be theoretically grouped into 3 categories:

  1. Real bugs. We will show you a few of these as an example.
  2. Not actually errors, yet these code fragments were confusing the analyzer and so they can confuse programmers who will study this code in the future. In other words, it was "sketchy" code that should be fixed as well. So we did.
  3. Edits made solely because of the need to "please" the analyzer that would generate false positives on those fragments. We were trying to isolate false warning suppressions in a special separate file or improve the work of the analyzer itself whenever possible. But we still had to do some refactoring in certain places to help the analyzer figure things out.

As I promised, here are some examples of the bugs. We have picked out the most interesting defects that were clear to understand.

The first interesting message by PVS-Studio: V506 Pointer to local variable 'NewBitmap' is stored outside the scope of this variable. Such a pointer will become invalid. fontcache.cpp 466

void GetRenderData(....)
{
  ....
  FT_Bitmap* Bitmap = nullptr;
  if( Slot->bitmap.pixel_mode == FT_PIXEL_MODE_MONO )
  {
    FT_Bitmap NewBitmap;
    ....
    Bitmap = &NewBitmap;
  }
  ....
  OutRenderData.RawPixels.AddUninitialized(
    Bitmap->rows * Bitmap->width );
  ....
}

The address of the NewBitmap object is saved into the Bitmap pointer. The trouble with it is that right after this, the NewBitmap object's lifetime expires and it is destroyed. So it turns out that Bitmap is pointing to an already destroyed object.

When trying to use a pointer to address a destroyed object, undefined behavior occurs. What form it will take is unknown. The program may work well for years if you are lucky enough that the data of the dead object (stored on the stack) is not overwritten by something else.

A correct way to fix this code is to move NewBitmap's declaration outside the if operator:

void GetRenderData(....)
{
  ....
  FT_Bitmap* Bitmap = nullptr;

  FT_Bitmap NewBitmap;
  if( Slot->bitmap.pixel_mode == FT_PIXEL_MODE_MONO )
  {
    FT_Bitmap_New( &NewBitmap );
    // Convert the mono font to 8bbp from 1bpp
    FT_Bitmap_Convert( FTLibrary, &Slot->bitmap, &NewBitmap, 4 );

    Bitmap = &NewBitmap;
  }
  else
  {
    Bitmap = &Slot->bitmap;
  }
  ....
  OutRenderData.RawPixels.AddUninitialized(
    Bitmap->rows * Bitmap->width );
  ....
}

The next warning by PVS-Studio: V522 Dereferencing of the null pointer 'GEngine' might take place. Check the logical condition. gameplaystatics.cpp 988

void UGameplayStatics::DeactivateReverbEffect(....)
{
  if (GEngine || !GEngine->UseSound())
  {
    return;
  }
  UWorld* ThisWorld = GEngine->GetWorldFromContextObject(....);
  ....
}

If the GEngine pointer is not null, the function returns and everything is OK. But if it is null, it gets dereferenced.

We fixed the code in the following way:

void UGameplayStatics::DeactivateReverbEffect(....)
{
  if (GEngine == nullptr || !GEngine->UseSound())
  {
    return;
  }

  UWorld* ThisWorld = GEngine->GetWorldFromContextObject(....);
  ....
}

An interesting typo is waiting for you in the next code fragment. The analyzer has detected there a meaningless function call: V530 The return value of function 'Memcmp' is required to be utilized. pathfollowingcomponent.cpp 715

int32 UPathFollowingComponent::OptimizeSegmentVisibility(
  int32 StartIndex)
{
  ....
  if (Path.IsValid())
  {
    Path->ShortcutNodeRefs.Reserve(....);
    Path->ShortcutNodeRefs.SetNumUninitialized(....);
  }
  FPlatformMemory::Memcmp(Path->ShortcutNodeRefs.GetData(),
                          RaycastResult.CorridorPolys,
                          RaycastResult.CorridorPolysCount *
                            sizeof(NavNodeRef));
  ....
}

The return result of the Memcmp function is not used. And this is what the analyzer didn't like.

The programmer actually intended to copy a region of memory through the Memcpy() function but made a typo. This is the fixed version:

int32 UPathFollowingComponent::OptimizeSegmentVisibility(
  int32 StartIndex)
{
  ....
  if (Path.IsValid())
  {
    Path->ShortcutNodeRefs.Reserve(....);
    Path->ShortcutNodeRefs.SetNumUninitialized(....);

    FPlatformMemory::Memcpy(Path->ShortcutNodeRefs.GetData(),
                            RaycastResult.CorridorPolys,
                            RaycastResult.CorridorPolysCount *
                              sizeof(NavNodeRef));
  }
  ....
}

Now let's talk about a diagnostic message you are sure to encounter in nearly every project - so common is the bug it refers to. We are talking about the V595 diagnostic. In our bug database, it is at the top of the list regarding the frequency of its occurrence in projects (see examples). At first glance, that list is not as large as, say, for the V501 diagnostic. But it's actually because V595 diagnostics are somewhat boring and we don't write out many of them from every single project. We usually just cite one example and add a note like: And 161 additional diagnostic messages. In half of the cases, these are real errors. This is what it looks like:


Attached Image: image6.png
Figure 4. The dread of V595 diagnostic.


Diagnostic rule V595 is designed to detect code fragments where a pointer is dereferenced before being checked for null. We always find some quantity of these in projects we analyze. The pointer check and dereferencing operation may be set quite far from each other within a function - tens or even hundreds of lines away, which makes it harder to fix the bug. But there are also small and very representative examples like, for example, this function:

float SGammaUIPanel::OnGetGamma() const
{
  float DisplayGamma = GEngine->DisplayGamma;
  return GEngine ? DisplayGamma : 2.2f;
}

PVS-Studio's diagnostic message: V595 The 'GEngine' pointer was utilized before it was verified against nullptr. Check lines: 47, 48. gammauipanel.cpp 47

We fixed this in the following way:

float SGammaUIPanel::OnGetGamma() const
{
  return GEngine ? GEngine->DisplayGamma : 2.2f;
}

Moving on to the next fragment:

V517 The use of 'if (A) {...} else if (A) {...}' pattern was detected. There is a probability of logical error presence. Check lines: 289, 299. automationreport.cpp 289

void FAutomationReport::ClustersUpdated(const int32 NumClusters)
{
  ...
  //Fixup Results array
  if( NumClusters > Results.Num() )         //<==
  {
    for( int32 ClusterIndex = Results.Num();
         ClusterIndex < NumClusters; ++ClusterIndex )
    {
      ....
      Results.Add( AutomationTestResult );
    }
  }
  else if( NumClusters > Results.Num() )    //<==
  {
    Results.RemoveAt(NumClusters, Results.Num() - NumClusters);
  }
  ....
}

In its current form, the second condition will never be true. It is logical to assume that the mistake has to do with the sign used in it that initially was meant to provide for removing unnecessary items from the Result array:

void FAutomationReport::ClustersUpdated(const int32 NumClusters)
{
  ....
  //Fixup Results array
  if( NumClusters > Results.Num() )
  {
    for( int32 ClusterIndex = Results.Num();
         ClusterIndex < NumClusters; ++ClusterIndex )
    {
      ....
      Results.Add( AutomationTestResult );
    }
  }
  else if( NumClusters < Results.Num() )
  {
    Results.RemoveAt(NumClusters, Results.Num() - NumClusters);
  }
  ....
}

And here's a code sample to test your attentiveness. The analyzer's warning: V616 The 'DT_POLYTYPE_GROUND' named constant with the value of 0 is used in the bitwise operation. pimplrecastnavmesh.cpp 2006

/// Flags representing the type of a navigation mesh polygon.
enum dtPolyTypes
{
  DT_POLYTYPE_GROUND = 0,
  DT_POLYTYPE_OFFMESH_POINT = 1,
  DT_POLYTYPE_OFFMESH_SEGMENT = 2,
};

uint8 GetValidEnds(...., const dtPoly& Poly)
{
  ....
  if ((Poly.getType() & DT_POLYTYPE_GROUND) != 0)
  {
    return false;
  }
  ....
}

Everything looks fine at a first glance. You may think that some bit is allocated by mask and its value is checked. But it is actually just named constants that are defined in the dtPolyTypes enumeration and they are not meant for allocating any certain bits.

In this condition, the DT_POLYTYPE_GROUND constant equals 0, which means the condition will never be true.

The fixed code:

uint8 GetValidEnds(...., const dtPoly& Poly)
{
  ....
  if (Poly.getType() == DT_POLYTYPE_GROUND)
  {
    return false;
  }
  ....
}

A typo detected: V501 There are identical sub-expressions to the left and to the right of the '||' operator: !bc.lclusters ||!bc.lclusters detourtilecache.cpp 687

dtStatus dtTileCache::buildNavMeshTile(....)
{
  ....
  bc.lcset = dtAllocTileCacheContourSet(m_talloc);
  bc.lclusters = dtAllocTileCacheClusterSet(m_talloc);
  if (!bc.lclusters || !bc.lclusters)   //<==
    return status;
  status = dtBuildTileCacheContours(....);
  ....
}

When copy-pasting a variable, the programmer forgot to rename it from bc.lclusters into bc.lcset.

Regular analysis results


The examples above are by far not all the bugs found in the project, but just a small part of them. We cited them to show you what kind of bugs PVS-Studio can find, even in world-class thoroughly-tested code.

However, we'd remind you that running a single code base analysis is not the right way to use a static analyzer. Analysis needs to be performed regularly - only then will it enable you to catch a huge bulk of bugs and typos early in the coding stage, instead of the testing or maintenance stages.

The Unreal Engine project is a wonderful opportunity to prove our words with real-life examples.

Initially we fixed defects in the code without keeping track of whether they were fresh changes or old. It simply wasn't interesting in the early stages, when there were so many bugs to get through. But we did notice how the PVS-Studio analyzer started detecting bugs in freshly written or modified code after we cut the number of warnings to 0.

In fact, it took us a bit longer than 17 days to finish with this code. When we stopped making edits and achieved a "zero defect" message from the analyzer, we had to wait for two days more for the Unreal Engine team to integrate our final Pull Request. During this time, we continually updated our version of the code base from the Epic's repository, and analyzing the new code.

We could see the analyzer detect bugs in new code during those two days. Those bugs, we also fixed. This is a great example of how useful regular static analysis checks are.

In fact, the tip of the "number of warnings" graph now looked like this:


Attached Image: image8.png
Figure 5. A schematic graph representing the growth of the warning number after it was cut to 0.


Now let's see what we managed to find during those last two days, when analyzing fresh updates of the project code.

Day one

Message one: V560 A part of conditional expression is always true: FBasicToken::TOKEN_Guid. k2node_mathexpression.cpp 235

virtual FString ToString() const override
{
  if (Token.TokenType == FBasicToken::TOKEN_Identifier ||
      FBasicToken::TOKEN_Guid) //<==
  {
    ....
  }
  else if (Token.TokenType == FBasicToken::TOKEN_Const)
  {
    ....
}

The programmer forgot to write Token.TokenType ==. It will cause the condition to always be true since the named constant FBasicToken::TOKEN_Guid is not equal to 0.

Message two: V611 The memory was allocated using 'new T[]' operator but was released using the 'delete' operator. Consider inspecting this code. It's probably better to use 'delete [] CompressedDataRaw;'. crashupload.cpp 222

void FCrashUpload::CompressAndSendData()
{
  ....
  uint8* CompressedDataRaw = new uint8[BufferSize];         //<==

  int32 CompressedSize = BufferSize;
  int32 UncompressedSize = UncompressedData.Num();
  ....
  // Copy compressed data into the array.
  TArray<uint8> CompressedData;
  CompressedData.Append( CompressedDataRaw, CompressedSize );
  delete CompressedDataRaw;                                 //<==
  CompressedDataRaw = nullptr;
  ....
}

This bug doesn't always show up in practice as we are dealing with allocation of an array of items of the char type. But it is still a bug that can cause undefined behavior and must be fixed.

Day two

Message one: V521 Such expressions using the ',' operator are dangerous. Make sure the expression is correct. unrealaudiodevicewasapi.cpp 128

static void GetArrayOfSpeakers(....)
{
  Speakers.Reset();
  uint32 ChanCount = 0;
  // Build a flag field of the speaker outputs of this device
  for (uint32 SpeakerTypeIndex = 0;
       SpeakerTypeIndex < ESpeaker::SPEAKER_TYPE_COUNT,    //<==
       ChanCount < NumChannels; ++SpeakerTypeIndex)
  {
    ....
  }

  check(ChanCount == NumChannels);
}

A nice, fat bug.

The comma operator ',' is used to execute the two expressions to the either side of it in the left-to-right order and get the value of the right operand.

As a result, the loop termination condition is represented by the following check only: ChanCount < NumChannels.

The fixed condition:

static void GetArrayOfSpeakers(....)
{
  Speakers.Reset();
  uint32 ChanCount = 0;
  // Build a flag field of the speaker outputs of this device
  for (uint32 SpeakerTypeIndex = 0;
       SpeakerTypeIndex < ESpeaker::SPEAKER_TYPE_COUNT &&
       ChanCount < NumChannels; ++SpeakerTypeIndex)
  {
    ....
  }
  check(ChanCount == NumChannels);
}

Message two. V543 It is odd that value '-1' is assigned to the variable 'Result' of HRESULT type. unrealaudiodevicewasapi.cpp 568

#define S_OK       ((HRESULT)0L)
#define S_FALSE    ((HRESULT)1L)

bool
FUnrealAudioWasapi::OpenDevice(uint32 DeviceIndex,
                               EStreamType::Type StreamType)
{
  check(WasapiInfo.DeviceEnumerator);

  IMMDevice* Device = nullptr;
  IMMDeviceCollection* DeviceList = nullptr;
  WAVEFORMATEX* DeviceFormat = nullptr;
  FDeviceInfo DeviceInfo;
  HRESULT Result = S_OK;                      //<==
  ....
  if (!GetDeviceInfo(DataFlow, DeviceIndex, DeviceInfo))
  {
    Result = -1;                              //<==
    goto Cleanup;
  }
  ....
}

HRESULT is a 32-bit value split into three different fields: error severity code, device code, and error code. To work with HRESULT, special constants are used such as S_OK, E_FAIL, E_ABORT, and so on. And to check HRESULT values, such macros as SUCCEEDED and FAILED are used.

Warning V543 is output only when the programmer attempts to write values -1, true, or false into a variable of the HRESULT type.

Writing the value "-1" is incorrect. If you want to report some unknown error, you should use the value 0x80004005L (Unspecified failure). This and other similar constants are defined in "WinError.h".

Wow, this was a lot of work!


It may make some programmers and managers feel sad to learn that they need over two weeks to integrate static analysis into their project. But you don't necessarily have to go this way. You just should understand that the Epic Games developers chose an ideal path, yet not the simplest and quickest one.

Yes, the ideal scenario is to get rid of all the bugs right away and then promptly address only new messages triggered by freshly written code. But you can also start benefiting from static analysis without having to spend time up front fixing the old code.

PVS-Studio actually offers a special "message marking" mechanism for this purpose. Below is a general description of this feature:

All the messages output by the analyzer are marked in a special database as inactive. After that, the user can see only those messages which refer to freshly written or modified code. That is, you can start benefiting from static analysis right away. And then, when you have time and mood, you can gradually work on messages for the old code.

For details on this subject, see the following sources: documentation, how to quickly integrate static analysis into your project.

"Have you reported the bugs to the authors?"


After publishing every new article about checking some project, people will ask: "Have you reported the bugs to the project authors?" And of course we always do! But this time, we've not only "reported the bugs to the authors" but fixed all those bugs ourselves. Everyone interested can benefit from the results themselves in the Unreal Engine repository on GitHub (after you've created an Epic Games account and linked your GitHub account)

Conclusion


We hope that developers using Unreal Engine will appreciate PVS-Studio's role in improving Unreal Engine's source codend we are looking forward to seeing many awesome new Unreal Engine-based projects!

Here are some final conclusions to draw from the results of our work:

  1. The Unreal Engine project's code is extremely high-quality. Don't mind the large number of warnings at the initial stage: it's a normal thing. Most of those warnings were eliminated through a variety of techniques and settings. The number of real bugs detected in the code is very small for such a large project.
  2. Fixing someone else's code you are not familiar with is usually very difficult. Most programmers probably have an instinctive understanding of this. We are just telling an old truth.
  3. The speed of "sorting out" analyzer warnings is not a linear one. It will gradually drop and you need to keep that in mind when estimating the time it will take you to finish the job.
  4. You can only get the best from static analysis when you use it regularly.

Thanks to everyone for reading this article. May your code stay bugless! Sincerely yours, developers of the PVS-Studio analyzer. It's a good time right now to download and try it on your project.

Math for Game Developers: Probability and Randomness

$
0
0
Math for Game Developers is exactly what it sounds like - a weekly instructional YouTube series wherein I show you how to use math to make your games. Every Thursday we'll learn how to implement one game design, starting from the underlying mathematical concept and ending with its C++ implementation. The videos will teach you everything you need to know, all you need is a basic understanding of algebra and trigonometry. If you want to follow along with the code sections, it will help to know a bit of programming already, but it's not necessary. You can download the source code that I'm using from GitHub, from the description of each video. If you have questions about the topics covered or requests for future topics, I would love to hear them! Leave a comment, or ask me on my Twitter, @VinoBS

Note:  
The video below contains the playlist for all the videos in this series, which can be accessed via the playlist icon at the top of the embedded video frame. The first video in the series is loaded automatically


Probability and Randomness


2D Lighting System in Monogame

$
0
0
This tutorial will walk you through a simple lighting/shadow system.

Go into your current Monogame project, and make a new file called

lighteffect.fx


This file will control the way our light will be drawn to the screen. This is an HLSL style program at this point. Other tutorials on HLSL will be available in the main website which will allow you to do some wicked cool things like; distorting space and the map, spinning, dizzyness, neon glowing, perception warping, and a bunch of other f?#%! amazing things!

Here is the full lighteffect file.

	sampler s0;  
		
    texture lightMask;  
    sampler lightSampler = sampler_state{Texture = lightMask;};  
      
    float4 PixelShaderLight(float2 coords: TEXCOORD0) : COLOR0  
    {  
        float4 color = tex2D(s0, coords);  
        float4 lightColor = tex2D(lightSampler, coords);  
        return color * lightColor;  
    }  

	      
    technique Technique1  
    {  
        pass Pass1  
        {  
            PixelShader = compile ps_2_0 PixelShaderLight();  
        }  
    }  

Now, don’t get overwhelmed at this code if you aren’t familiar with HLSL. Basically, this effect will be called every time we draw the screen (in the Draw() function). This .fx file manipulates each pixel on the texture that is loaded into it, in this case it would be the sampler variable.

sampler s0;

This represents the texture that you are manipulating. It will be automatically loaded when we call the effect. s0 is a sample register that SpriteBatch uses to draw textures, so it is already initialized. Your last draw function initializes this register, so you don’t need to worry about it!

(I explain more about this below)

RenderTarget2D

Render targets are textures that are made on the fly by drawing onto them using spriteBatch, rather than drawing directly to the back buffer.

texture lightMask;  
sampler lightSampler = sampler_state{Texture = lightMask;};

The lightMask variable is our render target that will be created on the fly using additive blending and our light’s locations. I’ll explain more about this soon, here we are just putting the render target into a register that HLSL can use (called lightSampler).

Before I can explain the main part of the HLSL effect, I need to show you what exactly is happening behind the scenes.

First, we need the actual light effect that will appear over our lights.

lightmask.png

I’m showing you this version because the one that I use in the demo is a white transparent gradient, it won’t show up on the website.

If you want a link to the gradient that I used in the demos above, you can find that at my main website.

Otherwise, your demo will look like the image below. You can see black outlines around the circles if you look close.


lightmaskdemo.png


Whatever gradient you download, call it

lightmask.png


Moving into your main game’s class, create a couple variables to store your textures in:

public static Texture2D lightMask;
public static Effect effect1;
RenderTarget2D lightsTarget;
RenderTarget2D mainTarget;

Now load these in the LoadContent() function. lightMask is going to be lightmask.png
effect1 will be lighteffect.fx
This is how I initialize my render targets:

var pp = GraphicsDevice.PresentationParameters;
lightsTarget = new RenderTarget2D(
GraphicsDevice, pp.BackBufferWidth, pp.BackBufferHeight);
mainTarget = new RenderTarget2D(
GraphicsDevice, pp.BackBufferWidth, pp.BackBufferHeight);

With that stuff out of the way, now we can finally focus on the drawing.

In your Draw() function, lets begin by drawing the lightsTarget:

GraphicsDevice.SetRenderTarget(lightsTarget);
GraphicsDevice.Clear(Color.Black);
spriteBatch.Begin(SpriteSortMode.Immediate, BlendState.Additive);
//draw light mask where there should be torches etc...
spriteBatch.Draw(lightMask, new Vector2(X, Y), Color.White);

spriteBatch.End();

Some of that is psuedo code, you have to put in your own coordinates for the lightMask. Basically you want to draw a lightMask at every location you want a light, simple right?

What you get is something like this: (The light gradient is highlighted in red just for demonstration)


lightmaskdemo2.png


Now in simple, basic theory, we want to draw the game under this texture, with the ability to blend into it so it looks like a natural lighting scene.

If you noticed above, we draw the light render scene with BlendState.Additive because we will end up adding this on top of our main scene.

What I do next is I draw the main game scene onto mainTarget.

GraphicsDevice.SetRenderTarget(mainTarget);
GraphicsDevice.Clear(Color.Transparent);          
spriteBatch.Begin(SpriteSortMode.Deferred, BlendState.AlphaBlend, null, null, null, null, cam.Transform);
cam.Draw(gameTime, spriteBatch);
spriteBatch.End();

Okay, we are in the home stretch! Note: All this code is sequential to the last bit and is all located under the Draw function, just so I don’t lose any of you.

So we have our light scene drawn and our main scene drawn. Now we need to surgically splice them together, without anything getting too bloody.
We set our program’s render target to the screen’s back buffer. This is just the default drawing space for the client’s screen. Then we color it black.

GraphicsDevice.SetRenderTarget(null);
GraphicsDevice.Clear(Color.Black);

Now we are ready to begin our splice!

spriteBatch.Begin(SpriteSortMode.Immediate, BlendState.AlphaBlend);

effect1.Parameters["lightMask"].SetValue(lightsTarget);
effect1.CurrentTechnique.Passes[1].Apply();                         
spriteBatch.Draw(mainTarget, Vector2.Zero, Color.White);               
spriteBatch.End();

We begin a spriteBatch whose blendstate is AlphaBlend, which is how we can blend this light scene so smoothly on top of our game.

Now we can begin to understand the lighteffect.fx file.

Remember from earlier;

sampler s0;     
texture lightMask;  
sampler lightSampler = sampler_state{Texture = lightMask;}; 

We pass the lightsTarget texture into our effect’s lightMask texture, so lightSampler will hold our light rendered scene.

tex2D is a built-in HLSL function that grabs a pixel on the texture at coords vector.
Looking back at the main guts of the effect function:

float4 color = tex2D(s0, coords);  
float4 lightColor = tex2D(lightSampler, coords);  
return color * lightColor;

Each pixel that we find in the game’s main scene (s0 variable), we look for the pixel in the same coordinates on our second render scene — the light mask (lightSampler variable).
This is where the magic happens, this line of code;

return color * lightColor;

Takes the color from our main scene and multiplies it by the color in our light rendered scene, the gradient. If lightColor is pure white (very center of the light), it leaves the color alone. If lightColor is completely black, it turns that pixel black. Colors in between(grey) simply tint the final color, which is how our light effect works!

Our final result (honoring the color red for demonstration):


Screenshot-2015-07-23-01.47.07.png


One more thing worth mentioning, effect1.Apply() only gets the next Draw() function ready. When we finally call spritebatch.Draw(mainTarget), it kicks in the effect file. s0‘s register is loaded with this mainTarget and the final color effect is applied to the texture as it is drawn to the player’s screen.

Be careful using this in your existing games, changing drawing blend states and sort modes could funk up some of your game’s visuals.

You can see a live example of what this system does in a top-down 2D rpg.


girlnextdoor.gifScreenshot-2015-06-24-18.29.06.png


The live gif lost some quality, the second screen shot shows you how it really looks.

You can learn more and ask questions at the original post; http://www.xnahub.com/simple-2d-lighting-system-in-c-and-monogame/

Memory Markers

$
0
0
Memory is something that is often overlooked in combat games, more often than not when a character becomes aware of you in a combatative action game, they remain aware until dead. Sometimes they may run a countdown when they lose sight of the player and lapse back into their patrol state if that ends before they find them.

Neither of these techniques looks particularly intelligent. The AI either looks unreasonably aware of you, or unrealistically gullible, in that they go about their business after they've lost track of you for a few seconds.

A memory marker is a simple trick (The UE4 implementation of which can be seen here) that allows you to update and play with the enemy's perception. It is a physical representation of where the enemy 'thinks' the player is.

In its simplest form, it has two simple rules:
  • The AI use this marker for searches and targeting instead of the character
  • The marker only updates to the player's position when the player is in view of the AI
this gives you a number of behaviours for free. For example, the AI will look as if you have eluded them when you duck behind cover and they come to look for you there. Just from this minor change you now have a cat-and-mouse behaviour that can lead to some very interesting results.


Capture.png


I was pleased to see that Naughty Dog also use this technique. In this Last of Us editor screen-grab, you can see their enemy marker (white) has been disconnected from the hiding character

It is also very extensible - in more complicated implementations (covered in future video tutorials) a list of these markers is maintained and acted upon. This lets us do things like have the AI notice a pickup when running after the player, and return to get it if they ever lose their target.

So how do we start to go about coding these markers?


In my experience the most important thing when coding this system in various forms is that your memory markers, in code and their references in script, must be nullable.

This provides us with a very quick and easy way of wiping these markers when they are no longer needed, or querying the null state to see if the agent has no memory of something - and therefore if we need to create it.

The first pass implementation of these markers simply has two rules:

  1. You update the marker for a character to that character's location when its been seen by an enemy.
  2. You make the AI's logic - search routines and so on - act on this marker instead of the character

It's worth mentioning that each AI will need one of these markers for every character on an opposing team, and every object they must keep track of.
Because of this, it is useful to populate some kind of array with these markers.

Think too, about how you can sort this list by priority. When the AI loses track of a target they can grab the next marker in the list which may be an objective, or a pickup they passed.

When the list is empty, they fall back to their patrol state.

Why NASA Switched from Unity to Blend4Web

$
0
0

Introduction


Recently, NASA published their press release which mentions the unique possibility to drive around on Mars. I couldn't help myself and right away clicked on the link that lead to an amusing interactive experience where I was able to drive the rover around, watch video streaming from its cameras in real-time and even find out the specs of the vehicle. However, what shocked me the most was that this has all been done using the Blend4Web engine - and not Unity.


Attached Image: gamedev_nasa1.jpg


Why was I so surprised? Even two yeas ago (or more) there were publications about NASA creating a similar demo using Unity. However, it didn't get passed the beta stage, and it looks like the space agency had moved on from Unity. It is interesting that the programmers of such a large organization chose to discontinue the time-invested project and begin from scratch. It took a little time but I was able to find the above-mentioned Mars rover app made in Unity. Honestly, it looks like an unfinished game. The scene loads slowly (especially the terrain), functionality is primitive – you can only drive, the overall picture is of horrible quality.


Attached Image: gamedev_nasa2.jpg


We all know wonderful games can be made with Unity and its portfolio is full of hundreds of quality projects. So, what's the deal?

What's the Deal


The reason is that Unity is seriously lagging behind when it comes to their WebGL exporter. The first alarm rang when Google Chrome developers declared NPAPI deprecated. This browser's global market share is too significant for any web developer to just ignore. You can find a lot of “advice” on using a magic option, chrome://flags/#enable-npapi, online. However, in September 2015 this loophole will disappear.

Creating games and web visualizations is an enterprise and nobody likes losing customers. Earlier, downloading the Unity plug-in was not as big of deal as it was with Flash – but now the situation has become completely different. The web plug-in can not be used anymore, while Unity's WebGL exporter is still in its infancy.

Developers of all kinds caused uproar, requiring the Unity team to proactively respond. Finally, Unity 5 has been released with WebGL support but only as a preview. Half a year has passed and the situation is not any better. They even came up with an “ingenious” method to check the user's browser and then recommend using Unity in another browser. Unfortunately, and for obvious reasons, it is not always reasonable.

And still, what's happening with Unity WebGL? Why is there still no stable version available? What are the prospects? These questions are of much interest to many developers. I'm not a techie, so it's difficult for me to understand Unity's issues in this area, but what I've found online is making me sad.

WebGL Roadmap


The official Unity forum has a thread called “WebGL Roadmap”. A team representative explains the future of WebGL in Unity. I have looked through this text thoroughly and it convinced me that the bright future Unity keeps promising is still in the far removed distance.

WebGL should work in all browsers on all platforms including mobile ones by default. It's not there. If you happen to successfully compile your game for WebGL, strike out mobile devices from the list. The reasons are clear: Unity's WebGL has catastrophically large memory consumption and bad performance. Yes, a top-of-the-line device can still manage to run the game at decent speed, but a cheaper one will run it as slow as a turtle.

And forget about hoping your project will work on desktops with ease. Browsers are the programs which eat all of a computer's free memory, and the half-finished Unity WebGL build often causes crashes and closes browser tabs (especially in Chrome).

There are some problems with audio. I personally tried to export a simple game for WebGL, and got croaking noise as the main character moved. The sound literally jammed and I could not fix it. The reason is poor performance, but other engines still work somehow...

Forget about in-game video. MovieTexture class is simply not supported for WebGL. As an alternative, the devs are suggesting to use HTML5 capabilities directly.

Network problems. System.IO.Sockets and UnityEngine.Network classes do not work for WebGL and will never work due to security issues.

I haven't enumerated all issues, but this doesn't answer the question – when will it start working? Alas, Unity devs' comments are unclear, obscure and don't include a specific timeline. Although I did find something:

“We are not committing to specific release dates for any of these features, and we may decide not to go ahead with some of these at all.”

They're Waiting


They are waiting for WebGL 2.0, which will be based on OpenGL ES 3.0. The future version, Unity 5.2, is planned to have an export option for the new API. However, I'm not sure that browsers will work with it – now WebGL 2.0 is available only as an experimental option.

They are waiting for WebAssembly, which is very promising but has just started being discussed. Nobody can even guess the date when it will be implemented.

I'm sorry, but if the problem can only be fixed, as they say, by upcoming third-party technologies, then maybe the problem lies in Unity WebGL itself?

Unity is a convenient, popular and cross-platform engine, an awesome tool for making games and I love it a lot. Still, this is a tool which can no longer be used for the web. The most annoying fact is that the future holds too much uncertainty.

You may say, “you are a pessimist!”. No, I'm just a realist, just like the NASA guys. This is the answer to the title of this article: “Why NASA Switched from Unity to Blend4Web”.

It's simple: Unity's WebGL is not ready... and will it ever be?

“We are not committing to specific release dates...”

So what about Blend4Web? I can only congratulate the developers with such a conclusive win in the field of WebGL – NASA's app has been showcased at the opening of the WebGL section on SIGGRAPH 2015 – which means competitors have no intention of waiting.

Background


This post is a translation of the original article (in Russian) by Andrei Prakhov aka Prand, who is the author of three books about Blender and a Unity developer with several indie games released.
Viewing all 17925 articles
Browse latest View live


<script src="https://jsc.adskeeper.com/r/s/rssing.com.1596347.js" async> </script>